Virtual Plant Provides Real Insights
Achieving good pH control can be tough. If a design objective is missed in any part of the pH control system, the system can fail miserably in meeting performance goals [1, 2]. Today, many pH control systems are operating in manual or severely oscillating in automatic. That’s really not too surprising because the extraordinary rangeability and sensitivity of pH measurement translates into exceptional requirements on equipment, piping, the control valve and measurement. For a true strong acid and strong base system, the slope of the titration curve and, hence, the process gain and sensitivity would change by a factor of 1 million. The mixing uniformity required to reduce pH noise from concentration gradients is way beyond the norm. Final reagent adjustments are so small that almost any dip tube or injection volume can create hours of deadtime in starting or stopping reagent delivery [1, 2]. The reagent control-valve-resolution requirement, which determines its rangeability and sensitivity, is 0.0001% for a single stage of neutralization; normally a valve resolution of 0.5% is considered adequate for process control [3].
Effective automatic pH control often should be possible — this belief led us to launch a project at Monsanto’s Luling, La., plant to improve a pH control system for wastewater.
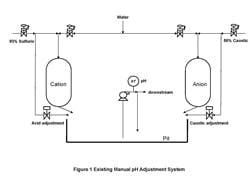
Figure 1. Existing system -- Manual pH adjustment
system required intensive efforts from operators.
Click on illustration for larger image.
Getting out of the pit
The wastewater, from regeneration of a water demineralizer, now goes to a system that consists of a 40,000-gal. pit with manual pH control (Figure 1). Because the demineralizer was regenerated at most once a day and the pit could hold all of the water from that unit, the operator usually had a day or more to make the adjustment. Our project objective was to replace the pit with a vessel with secondary containment and automatic pH control, which we thought could perform at least as well as an operator.
Veteran operators could get the pit within the permissible range of 6 to 9 pH by first opening the control valve to fill the line and then squirting in reagent by opening the block valve at the pit — but it was a very intensive activity. The relatively new operators didn’t fare as well, as evidenced by the late night phone calls saying the pit was 90% full, the pH wasn’t in range, and the next regeneration or area cleanup and pumpout was imminent.
At first, it seemed that automating the batch pH adjustment would be simple — however, a more detailed look revealed major uncertainty and sensitivity issues. A sensor error of 0.04 pH at 2 or 12 pH could cause a charge error of 20%. Because of the inevitable inaccuracies in the pH measurement and changes in the pH titration curve, at least five charges would be needed to walk one pH unit at a time from 2 or 12 pH to 7 pH. The batch system would need an accurate temperature-compensated titration curve to compute the charge and then would have to wait the entire mixing time of a charge to see the full effect. The last adjustments of reagent with 50% sodium hydroxide and 93% sulfuric acid, needless to say, would be touchy. Coriolis flow meters with 1/8-in. bodies and integrated batch control could make the final reagent charges accurate enough, but plugging was a concern. The real deal-breaker was that two expensive 40,000-gal. tanks would be needed to provide an online spare system for inspection and repair. With an installed cost exceeding $1 million and real estate an issue, we decided to use a modeling and control study to explore innovations.
The operators were using less than $2,500/yr. of reagent; so our goal was to minimize project cost while still meeting the objectives of safe, responsible (i.e., no downstream effluent excursions outside 6 to 9 pH), and reliable operation (i.e., ability to operate automatically despite a single failure anywhere in the equipment or control system). We wanted a control system that would be operator friendly and not require operator intervention. We also realized that the future is continuous pH control — could it meet project objectives and, if so, what size of tanks would be required? According to the traditional guideline, three stages of neutralization are needed because the influent could be below 2 or above 12 pH. Could better reagent injection methods, high-resolution control valves and advanced control reduce the size and number of tanks?
Virtual plant
We opted for a virtual plant to help develop the control system, investigate design details, test whether a prototype would meet project objectives, demonstrate the results to the mechanical, process and automation engineers, enable operator review and input, check out the control system configuration, and train operators for better understanding and operability [4, 5, 6, 7, 8]. Test runs of the virtual plant were used to study the dynamics of the system to guide the decision process and detail the equipment, piping, valve, measurement and control system design.
The virtual plant included a dynamic model of the process with material and charge balances as well as mixing and injection delays, and a dynamic model of the control valves with deadband and resolution limitations. The models were configured and embedded in a distributed control system (DCS) along with the control strategies. The integrated nature of the virtual plant eliminated the need for separate programs, interfaces and emulations. We could develop and test the actual control modules and displays used in the plant.
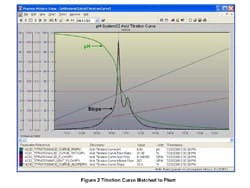
Figure 2. Titration curve -- It’s crucial to match
the slopes of the virtual plant and laboratory curves.
Click on illustration for larger image.
Titration curves. The first step was to get a representative titration curve for each part of the regeneration. It was critical to make sure the lab employed the same reagents used in the field, the sample bottles were kept closed, and the reagent concentration and drop size and the sample time and size were specified [1, 2]. A tabular printout was essential because a plot basically showed a straight vertical line between 3 and 11 pH. The next step was to match the titration curve of the process model with the laboratory titration curve. Here the slope of the curve, which sets the process gain and sensitivity, is most important. Figure 2 shows the same relative peaks in the slope in virtual plant curve near the control region evident in the lab curve. The slope at 7 pH was 18 compared to a slope of 0.016 at 12.2 pH. The maximum peak was moderated and a valley and second peak were created by the addition of small amounts of a weak base at 9 pH and weak acids at 4 and 6 pH. Once the curves were matched up, the demineralization unit batch sequence was run for different equipment, injection and automation system designs.
Speed. In a continuous pH control system, particularly for strong acids and bases, excursions in the effluent will occur because of upsets. It’s not commonly recognized that speed as well as size determines how disruptive a disturbance is to the effluent. Consequently, abrupt changes in flows from batch sequences, operator intervention, on/off operations and control valve stick-slip cause the biggest upsets.
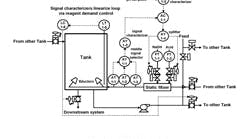
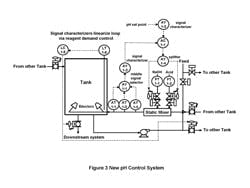
The virtual plant explored the use of a fast inline pH control system to catch up with disturbances, followed by a tank to smooth them out. By putting the pH loop in the recirculation line of a tank, the system could automatically switch between continuous and batch operation. The pH loop deadtime could be kept to less than 2 sec. because of a minimal transportation delay through the mixer, if the delays from reagent injection, control valve stiction and sensor response were minimized.
Figure 3. New pH system design -- When pH is out of
range, tank operates in recirculation mode.
Click on illustration for a larger image.
Control logic. When the pH was within range, the effluent would be sent downstream and the level maintained at a minimum to maximize the available space. When the pH was out of range, the tank would operate in the recirculation mode and adjust the pH until the level got above a maximum desired set point at which time it would send the effluent to the other tank if that tank had space. For tank 1 this meant sending the effluent to tank 2. In the unlikely event that tank 2 pH was out of range, it could send the effluent back to tank 1. We verified that linearization of the pH loop was beneficial and minimization of the acid and caustic valve stick-slip was essential. Figure 3 shows the new pH system.
Help Greg McMillan fine-tune his focus on pH issues by answering a few questions online at http://www.zoomerang.com/Survey/?p=WEB228KQLJS4K.
Taking part will give you a chance to win a copy of “Advanced pH Measurement and Control” as well as other prizes.
When taking the survey, if you don't know the answer to a particular question, just select the 0-1% choice.
Test results
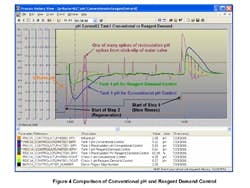
The trend chart (Figure 4) shows that the biggest upsets occur at the start of step 2 (beginning of first regeneration cycle), seen as a low pH excursion, and at start of the step 4 (beginning of slow rinse cycle), seen as a high pH excursion. It indicates that reagent demand control outperforms conventional pH control. Reagent demand control linearizes the loop by translating the process variable (PV) and its set point (SP) from pH to % reagent demand (X-axis of the titration curve). The controller gains are 0.25 and 0.02 for reagent demand control and conventional pH control, respectively. The reset time is 8 sec. in both cases. The higher controller gain enables the reagent demand loop to catch up faster to a big change in the influent. The reagent demand controller recognizes the true distance of the PV from the SP, which also is important for startup of the system.
Figure 4. Trend chart -- Reagent demand control
outperforms conventional pH control.
Click on illustration for a larger image.
We found the periodic spikes in the recirculation line pH originate from the stick-slip limit cycle of control valves due to the high pH sensitivity in the neutral region, which confirms the insight that steep titration curves require control valves with better than normal resolution. In fact, the typical valve resolution of 0.5% would have necessitated another stage of treatment with smaller reagent valves, conforming to the traditional guideline that two to three vessels in series would be required for this system. Besides increasing cost, adding another tank incurs the risk of simultaneous throttling of large (coarse) and small (trim) reagent valves in case of an upstream tank failure and self-inflicted disturbances from the limit cycle of the large valve that drive the pH out of specification for the last tank [9, 10].
Oneness
Each part of the system must be one with its role, goal and the whole to achieve the project objectives. The integrated nature of the virtual plant helps but, as usual, the details are important. The correct design and performance of a neutralization systems depends upon an integrated view of equipment, piping and control system dynamics. Once the simulated titration curve is matched to the lab curve, the problem becomes one of focusing on the design and installation of the right volumes, mixing, flows, valves, sensors, tuning and control strategies to meet the project goals. The virtual plant can serve in this role as well as provide a system for training and continuous improvement.
We should have field results later this year.
Gregory K. McMillan is a principal consultant for Emerson Process Management, Austin, Texas, Roger D. Reedy is a principal engineer for Monsanto in Luling, La., and John P. Moulis also is a principal engineer at Monsanto’s Luling plant. E-mail them at [email protected], [email protected]
and [email protected].
References
1. McMillan, G. and R. Cameron, “Advanced pH Measurement and Control,” 3rd ed., ISA, Research Triangle Park, N.C. (2005).
2. McMillan, G. K., A Funny Thing Happened on the Way to the Control Room, http://www.easydeltav.com/controlinsights/FunnyThing/default.asp.
3. McMillan, G. K., “Improve Process Loops,” Chemical Processing, p. 45 (October, 2007). www.ChemicalProcessing.com/articles/2007/200.html.
4. McMillan, G. K., Plant Design Category, http://ModelingandControl.com.
5. McMillan, G. K., Education Category, http://ModelingandControl.com.
6. McMillan, G. K., “Advances in pH Modeling and Control,” presented at ISA 54th Intl. Instrumentation Symposium, Pensacola, Fla. (May 2008).
7. McMillan, G. K. and M. S. Sowell, “Virtual Control of Real pH,” Control, p. 47 (Nov. 2007). www.ControlGlobal.com/articles/2007/385.html.
8. McMillan, G. K, “One Man’s Story — Back to the Future,” Control, p 91 (Oct. 2007). www.ControlGlobal.com/articles/2007/359.html.
9. McMillan, G. K., “What is your Flow Control Valve Telling You,” Control Design, , p. 43 (May 2004). www.ControlDesign.com/articles/2003/164.html.
10. McMillan, G. K., “A Fine Time to Break Away from Old Control Valve Problems,” Control, p. 57 (Nov. 2005). www.ControlGlobal.com/articles/2005/533.html.
