1660602551370 1403alarmmanagementts

Plant Assesses Alarm Displays

March 6, 2014
Trial finds that many operators prefer an alternative visualization approach

Alarm flooding is the phenomenon of presenting more alarms in a given time period than a human operator can effectively address. A significant finding of a 2006 research project of the Abnormal Situation Management (ASM) Consortium  was that even though configuration techniques can significantly reduce the size of the alarm flooding associated with process upsets, these techniques on their own don't suffice to reduce the alarm loads to a level at which human operators can mentally process and physically respond. A key need that remains is to provide effective alarm summary displays to help operators cope with these inevitable alarm floods.

In plants where modern distributed control systems (DCSs) are installed, alarms are presented via scrolling lists on console monitors instead of via dedicated annunciator tiles as was done on older direct-wired panel boards. The traditional practice is to show alarms using a chronologically sorted list-based alarm summary display. The usability challenges of this display during an alarm flood include the fact that alarms move through the list and off the page faster than a typical operator can read them [1, 2]. The viewable list for a given page also fills up quickly; operators must scroll or change pages to see all the alarms that are occurring — taking their attention away from their operating displays and wasting valuable time. A consequence of the scrolling list is that alarms will move down the list as the operator actually is trying to read it; so to read the alarm details, the operator's gaze must descend at the same rate as the changing alarm position. Higher priority alarms also will be scrolled off a given page as it fills up while the operator's attention is directed elsewhere. Similarly, alarms that came in earlier in the flood (and that the operator may be "chasing" on other operating graphics) will have moved to successive pages in the alarm summary display. Therefore, the operator won't notice if any of these "clear" on their own accord.

It is apparent that the rapidly changing, chronological list-based alarm summary display installed in most process plants doesn't support the operator's situation awareness. The alarm list display tends to be too detailed with the presentation of sequential information and lacks the functional organization necessary to understand the nature and progress of a disturbance. Therefore, the ASM Consortium members decided to explore alternative visual display techniques that might improve operator situation awareness during plant upsets that result in these inevitable alarm flood situations [3, 4].

EXPLORING ALTERNATIVES
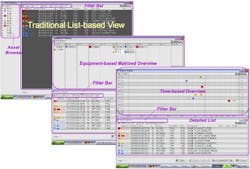
The consortium conducted a series of studies in 2007–2008 with experienced console operators in a controlled experimental setting to examine how two alternative visualization techniques compared to the traditional list-based alarm display (Figure 1) on operators' ability to respond to alarm flood scenarios.

ALARM DISPLAYS USED

Figure 1. Operators evaluated two alternatives as well as traditional list-based visualization.

Alternative Visualization No. 1 was an alarm display with an equipment-based overview — each major equipment area for which the console operator is responsible is represented at the top of the display in a single or double row of alarm panels. The panels are arranged in a left-to-right organization that intuitively reflects the plant process flow or geographical arrangement. Within each panel, alarm indicators are arranged vertically with the most recent alarms appearing at the top. Each alarm indicator provides key attributes such as alarm priority, acknowledgement status, alarm type, parameter type and a short tag descriptor. A mouse-over with the cursor results in the display of a full alarm description. The selection of a specific equipment area panel focuses the content of the detailed list (i.e., just below the overview) on alarms for just that area.Alternative Visualization No. 2 was an alarm display with a time-based overview — each major equipment area for which the console operator is responsible is represented at the top of the display in rows of alarm panels (i.e., consistent with the two other summary displays). The panels are arranged in a top-to-bottom organization that intuitively reflects the plant process flow or geographical arrangement. Within each panel, alarm indicators are arranged horizontally with the most recent alarms appearing on the right (in a fashion similar to a trend display with the most recent information on the right). The selection of a specific equipment area panel focuses the content of the detailed list on alarms for just that area.The study participants were volunteers — 45 active console operators from four plants in the Sasol Secunda Synfuels operations. Each operator received a two-hour familiarity training session on the display concepts and the alarm response task. In the performance evaluation sessions, each operator handled alarm floods in six simulated scenarios. The operators were asked to respond to an individual alarm or a group of alarms in the alarm scenario by pointing out where in the plant the problem was (i.e., specific unit and particular piece of equipment), what the key alarms were (i.e., indicators) and what underlying abnormal conditions were signified (i.e., conditions). As the alarms were appearing on the alarm summary displays, the participants continuously were trying to detect and interpret as many alarms as possible to respond to the underlying abnormal plant conditions.The alarm flood scenarios lasted from 8 to 10 minutes. The average alarm rate across the flood scenarios was 110 per 10 minutes, with a range of 32 to 316 total alarms. The number of unique alarms averaged 30 per 10-minute scenario, with a range of 14 to 42. The number of plant equipment areas ranged from 6 to 11.In the familiarity training session, operators were shown an "effective" alarm response strategy to help improve situation awareness during alarm flooding situations. This effective strategy, which could be used with the traditional list-based display as well as with the new alternative displays, comprised:• using the summary view to determine what equipment area required attention; • selecting just that area for viewing in the alarm list; • evaluating the pattern of alarms in that area; • completing the alarm response task in an Access database form;• returning to the alarm list; and• acknowledging all alarms (as opposed to acknowledging individual alarms).Less effective strategies were characterized by:• not focusing the alarm list by equipment area and acknowledging all alarms in the alarm list while all units were shown; or• not focusing the alarm list by equipment area and only acknowledging single alarms.
Alarm Management Podcast

The people who control chemical processes (the operators) must monitor more equipment and have less hands-on experience with the process, making it harder for them to be effective. Traci Purdum, Chemical Processing's senior digital editor, talks with Dave Strobar -- principal human factors engineer for Beville Engineering. Dave is also a guiding light behind the Center for Operator Performance. Listen to this podcast.

THE RESULTSThe trial generated three key findings:1. The effectiveness of a particular display design can be influenced by the alarm response strategy used when interacting with that display. The study results found both effective and ineffective strategies for all three alarm-summary display designs. Most importantly, all three designs provided features that enabled operators to strategically focus the contents of the detailed alarm list view on a specific equipment area of interest to reduce the number of alarms seen. Significant positive correlations were found between the operators' alarm response score, indicating better situation awareness, and their respective effective strategy score. Moreover, the benefit of the effective alarm strategy was greater with the time-based overview visualization technique than with the traditional list-based alarm summary display. This strategy was impactful because it allowed the operators to be aware of more alarm conditions and see patterns in the alarms associated with an equipment area that were not readily perceptible when distributed within the list of all alarms. 2. The effective response to alarm flood conditions may depend upon operator training. Another observation from the study was that — despite the project team purposefully training each operator on the effective strategy of using the summary view to focus what equipment area was in the alarm list — many operators reverted back to the strategy they brought to the study, based on how they interact with the existing DCS alarm summary display (similar to the industry-typical display used in the study). The consequence of this very common behavior was that each of the three display conditions essentially was reduced to a single alarm list, with no summary information being used. The training session didn't include feedback on performance. Hence, some operators thought they actually performed better when they didn't use the effective alarm response strategy. In fact, some had the mistaken perception they were performing better because they were aware of fewer alarms, i.e., they weren't aware of what they weren't responding to. Training that includes feedback on performance has a better chance of establishing the value of using the effective alarm response strategy.3. With the option to choose display type, the operators prefer the new time-based display to the traditional display. An alarm summary display with the time-based overview was installed in a control room for three months to allow operators to get familiar with the display during a pilot study period. That control room has two console areas, each devoted to a specific processing unit. In one console area, half the operators chose to use the new display over the traditional display during their normal shift duties. In the other, all the operators opted to use the new display. Operators reported they were better able to associate groups of alarms with specific equipment areas and contextualize alarms in time in terms of old and new concerns. After the pilot was completed, the operators requested the prototype display be left in the control room.In conclusion, the ASM research studies revealed some promising findings on alarm presentation techniques that can enable operators to better manage plant upset situations that result in alarm floods. Past research has revealed significant usability issues with the traditional presentation in list format. The Sasol trial showed that console operator performance improved with all the alarm presentation techniques when an effective alarm response strategy also was used. Specifically, the study demonstrates that operator performance under alarm flood conditions can be upgraded if the operator interface allows the operator to strategically view subsets of the alarms associated with specific equipment areas rather than a list containing all the alarms. The time-based overview visualization coupled with an effective alarm response strategy produced the best alarm awareness. Future research examining the impact of potential enhancements to the new display concepts might provide additional insight on how to resolve this significant challenge in the process industries. Meanwhile, Sasol has chosen to adopt the new visualization developed on the Honeywell Experion platform as the Alarm Tracker display.

PETER T. BULLEMER is Independence, Minn.-based senior partner of Human Centered Solutions. DAL VERNON C. REISING is Canton, Mich.-based senior partner of Human Centered Solutions. MISCHA TOLSMA had been divisional manager, instrumentation and control engineering, for Sasol, Secunda, South Africa, during the time of the trial; he now is senior operations management engineer for Shell Global Solutions, The Hague, Netherlands. JASON C. LABERGE had been leader at Honeywell's Human Factors Center of Excellence, Golden Valley, Minn., when this trial took place; he now is manager of human factors for Alberta Health Services, Calgary, Alberta. E-mail them at [email protected], [email protected], [email protected] and [email protected].
    
REFERENCES
1. Bransby, M., "Design of Alarm Systems," p. 207 in "People in Control: Human Factors in Control Room Design," J. Noyes and M. Bransby, eds., Institution of Electrical Engineers, London, U.K. (2001).
2. Brown, W., O'Hara, J. and Higgins, J., "Advanced Alarm Systems: Guidance Development and Technical Basis," (NUREG/C$-6684), U.S. Nuclear Regulatory Commission, Washington, D.C. (2000).
3. Bullemer, P. T., Tolsma, M., Reising, D. C. and Laberge, J. C., "Towards Improving Operator Alarm Flood Responses: Alternative Alarm Presentation Techniques," Proceedings of the ISA Automation Week Conference (Chicago, Ill.), ISA, Research Triangle Park, N.C. (2011).
4. Laberge, J., Bullemer, P., Tolsma, M., and Reising, D., "Addressing Alarm Flood Situations in the Process through Alarm Summary Display Design and Alarm Response Strategy," accepted for publication in Intl. Journal of Industrial Ergonomics.

Sponsored Recommendations

Keys to Improving Safety in Chemical Processes (PDF)

Many facilities handle dangerous processes and products on a daily basis. Keeping everything under control demands well-trained people working with the best equipment.

Get Hands-On Training in Emerson's Interactive Plant Environment

Enhance the training experience and increase retention by training hands-on in Emerson's Interactive Plant Environment. Build skills here so you have them where and when it matters...

Rosemount™ 625IR Fixed Gas Detector (Video)

See how Rosemount™ 625IR Fixed Gas Detector helps keep workers safe with ultra-fast response times to detect hydrocarbon gases before they can create dangerous situations.

Micro Motion 4700 Coriolis Configurable Inputs and Outputs Transmitter

The Micro Motion 4700 Coriolis Transmitter offers a compact C1D1 (Zone 1) housing. Bluetooth and Smart Meter Verification are available.