A key objective of Celanese is to drive energy efficiency and cost reduction in its plants. In line with this, the company has become a partner in the Better Plants Challenge of the U.S. Dept. of Energy.
One way to attain such benefits is to engage the entire operations organization in energy reduction. At Celanese, energy optimization historically was a management or engineering responsibility. However, we realized that process operators took care of real-time control of energy but usually weren’t actively optimizing consumption.
Celanese discovered that these operators, if given access to real-time information on energy consumption as well as targets for the key energy consumers, could optimize energy use in the plants more effectively.
[callToAction ]
As a result, the company created energy dashboards to provide operators with access to real-time energy consumption and dynamic energy target information — thus giving them appropriate knowledge and tools to reduce energy use. We’ve found these energy dashboards are a great way to get energy information into the hands of the people who can respond immediately.
Celanese implemented the first energy dashboard in 2013; now six sites have dashboards in place. We currently are working to roll out the dashboard concept to three more sites in 2017–18.
Real-Time Information
A large chemical plant’s energy systems are complex. The optimum ranges of process energy consumption change often, based on production rate and many other factors such as equipment use or product mix. The operators responsible for continuously monitoring the processes and process equipment sometimes are best positioned to make decisions and take immediate action on energy usage and optimization in their sections of the plant. Although Celanese plant operating personnel understood the importance of energy management, the existing control screens, i.e., the human/machine interfaces (HMIs), didn’t give them the level of information required to optimize energy in real time.
To improve this situation, Celanese upgraded the process control HMIs so the operators could get a better understanding of process energy flows and optimum energy targets in real time — and empowered them to take appropriate action to ensure the processes maximize energy efficiency and reliability.
Visualization was crucial for imparting better understanding, so we created energy dashboards. These provide a simple and continuous in-plant display of energy consumption and target ranges with the capability also to view the individual drivers that impact overall energy consumption.
The development of the energy dashboards included three main phases — evaluate, implement and sustain.
During the evaluate and implement phases, a cross-functional internal group of process engineers, operators, and six-sigma black belts collaborated to map the energy users and key drivers, analyze energy data, develop the energy models, and set up the dashboards in the plant. The six-sigma black belts leveraged their statistical expertise to do the statistical modeling that identified the process variables affecting energy consumption.
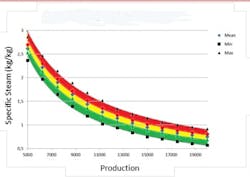
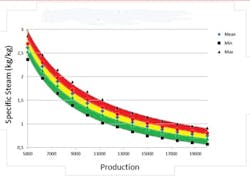
Figure 1. Diagram of specific steam usage splits performance into three bands indicating poor (red), fair (yellow) and optimal (green) operation.
The plants already had in place the required equipment, supervisory control and data acquisition (SCADA), HMI and data historian systems as well as the necessary statistical software packages. All that was needed was to apply internal resources, including Celanese’s six-sigma and process experts.
Some of the relationships between energy and the processes weren’t readily apparent. So, the six-sigma experts collected feedback from engineers and operators. This enabled them to accurately model the key energy consumption drivers, establish the data collection protocols and statistical models, and develop the displays. Statistical modeling and regression of the key process inputs identified energy-consumption target ranges.
In the sustain phase, the operations teams developed a process to cover energy-related issues at shift-handoff and routine production meetings so that energy discussion became part of the regular cadence of plant operations. Leveraging existing meetings and systems ensured sustainability of the energy review and use of the dashboards. In addition, to share energy best practices in the plant, sites developed an operations energy playbook based on actions taken from the dashboard information.
Some of the challenges included getting sufficiently accurate data to develop the correlations between energy consumption and key process variables due to infrequent lab testing, inaccurate instrumentation, and lack of some in-place measurements.
Another challenge was getting buy-in from the operating personnel that the models were accurate and could be acted on routinely and effectively. Involving the operators in each step of the dashboard development process played a significant role in obtaining buy-in. Such involvement meant the operators understood and had input into how the dashboards were developed.
Each rollout invariably uncovers something new to improve the dashboard such as statistical or display methods or the implementation process. A dashboard requires three-to-six months to develop and roll out; the first one at a plant takes longer but subsequent dashboards go quicker as the plant becomes more familiar with the process. Also, sometimes we run into issues with the data, HMI, resource priorities, etc., that may lengthen rollout times.
Celanese also performed rigorous testing of each dashboard before full implementation. In these test runs, a site typically would apply the dashboard in one plant unit and validate the models in real-time operation. After the dashboard had been tested and is tuned and working well, the plant then would roll out the system.
Plant engineers follow up daily on the energy information and operator feedback to identify potential projects to reduce energy cost or usage. These often are no or low capital-cost projects such as for improved control, enhancing or repairing instrumentation, operator training and awareness.
“The energy dashboards allow energy performance to become a topic easy to discuss at all organization levels, favoring an idea-generation environment,” notes Siddharta Sotomayor, energy coordinator at our Octolan, Mexico, site.
Energy Curve And Targets
Celanese looks at the total energy consumption of individual units within a plant. A team that includes six-sigma experts develops an energy curve (Figure 1) to model the energy consumption and identifies target ranges through statistical modeling and regression of the individual drivers that impact overall energy usage. Ranges are dynamic, varying with rate, product mix or other parameters. However, the models enable establishing red, yellow and green zones and action trigger points. Red indicates operation is outside process boundaries and the energy optimum; yellow signifies it’s within process boundaries but not in the energy optimum; and green denotes the optimal range.
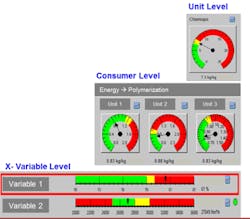
With the dashboards (Figure 2), operators can see if the real-time energy consumption is in the most efficient — green — range. They can monitor overall unit-level energy performance, as well as the specific key energy drivers’ performance against their dynamic energy optimum targets at the sub-unit (consumer) level and equipment or process (x-variable) level such as a heat exchanger or reflux ratio. Operators can drill down into the key process variables to see the cause of deviations, and can diagnose problems and initiate actions to improve energy efficiency.
Figure 2. Operators can see details on consumption at levels from the overall unit to an individual heat exchanger or specific reflux ratio.
When an energy exception — “out of the green” — occurs, operators use the dashboards to determine the cause of the energy inefficiency and to make effective decisions for correcting the problem. They also fill in an exception log, documenting the energy gap that occurred and the action taken. Engineers and operators review the exception log, giving feedback on the effectiveness of the action as well as sharing best practices.
Use of the dashboards has improved the plants’ energy situational awareness and is allowing the operators and engineers to find energy reduction opportunities. The dashboards enable operators to understand the effect of control issues, equipment configuration and different practices between the shifts and how they impact energy consumption.
Clear Expectations
Operators must properly understand the role of the dashboard tool to use it effectively. Its aims are to bring clearer focus on energy efficiency by providing real-time energy consumption and dynamic targets to the unit and operator level, drive incremental energy improvement, help find new energy-savings opportunities, and give operators a tool for grasping the complex interactions affecting energy and for understanding the balance between energy and the other priorities. The dashboards aren’t a signal to make energy a priority over process safety, quality or productivity. They aren’t intended to promote constant tweaking of the process or to create the expectation that operators on shift can solve all energy issues.
The dashboards have been effective in driving reductions in energy cost and consumption. One plant realized an annual savings of more than $300,000 just by providing operators accurate energy information so they could make adjustments in real time to improve energy efficiency. Also at the same plant, the analysis, modeling and dashboards’ use has spurred more than $1.5 million of new energy-improvement projects.
Learn More About The Program
The Better Buildings, Better Plants Program of the U.S. Department of Energy (DOE) is a voluntary initiative to drive significant energy efficiency improvement in industry. Currently, 187 leading U.S. manufacturers and public water- and wastewater-treatment utilities are partnering with DOE through Better Plants to enhance energy efficiency and cut energy costs. For more information, visit http://goo.gl/q6z5X3.
DAVID REID is the global energy and productivity leader for Celanese Corp., Irving, Texas. Contact him at [email protected].


