Utilizing maintenance data to make key business decisions results in improved equipment reliability, optimized costs, improved safety, and environmental impacts. However, there are many challenges due to a lack of know-how, resources, and data quality issues.
To understand and mitigate those challenges, Chemical Processing spoke with Manjish Naik, Product Manager at GE Digital. He worked with several processing plants in the oil and gas, power, and chemicals markets to identify bad actors and unearth the most optimal asset strategy.
Q: What's the best way to focus reliability initiatives and how can facilities take advantage of the data they already have?
A: It's important to tie your reliability improvements with your business goals and reliability initiatives. Many times, there are very high-level targets in terms of maintenance. First, the need to increase uptime by a certain percent. Also, increase asset availability. It's great to have those as a guiding compass but, how are you going to achieve that?
Product Manager at GE Digital
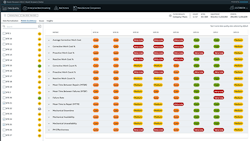
That's the problem many companies struggle with today, to understand how to turn that high-level goal into an actionable plan at the asset level, not just at the facility level or the unit level. This is where the benchmarking aspect of reliability analytics and metrics really comes in handy.I work as a product manager on the Asset Answers product at GE Digital. Over the past decade we've collected maintenance\work-history information from hundreds of companies in the chemical, oil and gas, and power space creating a benchmarking database. Using this information GE understands the opportunity facilities must improve cost savings for any specific type of equipment — centrifugal pumps, AC motors or any other equipment. Foundationally, benchmarking tells you where you are today specifically on asset-related metrics, not just from a high-level view.Secondly, Asset Answers tells you where to focus. If you need to save $5 million in that year, where do you focus? Which assets are really the ones that are the key drivers and give the biggest bang for the buck?Q: Facilities don't measure analytics for analytics sake. So, what is the point?
A: Business goals are important to set; the devil is in the details. What are the analytics needed to measure progress to achieve the business goals? If you are doing 50 metrics, that's great, but how are those metrics utilized? Are you measuring progress toward a business goal? Being laser focused on only the metrics that will help you understand where the business is currently and future performance levels.
Q: Data quality is an issue. How can you avoid bad data?
A: Every customer I've talked with experiences data quality problems. This naturally happens because data is entered by humans and there is a disconnect between the person entering the data and the person using the data for analytics. If you have bad data, you also have good data. Therefore, it is important for to understand data that requires improvement and the usable good quality that is leveraged today. And that's where data quality measurement comes into the picture.
I recommend an approach in parallel, first measuring the data and second measure the quality of that data. Good data is imperative to start using make impactful decisions. The data requiring improvement, start improving it as a parallel path. Don’t wait until the data is perfect. Honestly, the data is never going to be perfect. You need to start utilizing what you have and then improve the overall data quality.
There are two ways I recommend improving the data quality. The future data is addressed by improving people, processes, and technologies. The historical data can be mined using natural language processing. Future data improvement: first, ensure people understand how the data is being used and why it is important to capture the data. Don't boil the ocean with the data; don't require collecting hundreds of fields that do not make sense. Laser-focuse on the metrics you're looking at and the data needed driving the metrics. Implement accountability and governance in a way certain fields are required, and the work order cannot be closed without those completed fields.
Finally, implement robust technology incorporating consistent and logical business rules to ensure accurate data collection. Many times, workers try to pick something from a list, for example, choosing a value for a failure mode. Typically, you might see a long list of items not applicable to what you're trying to accomplish. Generic items consist of asset failed, pump failure, and pump fixed that doesn’t apply.
Asset Answers determines areas of good data and data that needs improvement and provides actionable recommendations — all while keeping data anonymous.
Q: Are there telltale metrics that can prove ROI for proactive maintenance activities?
A: Focus on asset-level metrics, because there are many high-level metrics. It's important to focus on the metrics that are calculated in a systematic way. Spending excessive hours on spreadsheets to calculate metrics, waists valuable man hours.
I recommend focusing on proactive actions. Apply reactive and corrective work distributions in terms of cost and count.
The mean time between failures is a very typical metric that everybody looks at, but a lot of the times the data is not there to calculate metrics. Instead, I recommend performing mean time between repairs, which tell you how frequently you're doing repairs on the assets. The other important one is mean time to repair – respectively, how much time on average it takes to repair assets. Proactive maintenance effectiveness is another aspect, which tells you out of all your repairs, what percent of repairs were identified proactively versus after the asset failed. Downtime is an important metric.
All the metrics I mentioned, are calculate within 30 to 40 fields in the CMMS and that's the standard data available in all CMMS systems.
Q: How can facilities tell if their maintenance initiatives are working?
A: Keep looking at the metrics. Is the metric performance improving? Is the gap closing between you and the peer, or the target goal in place? That's when dashboards and tracking metrics in a systematic way over time help you understand the performance changes.
Q: Do you have anything to add?
A: I mentioned benchmarking many times, but it's important to receive feedback — what we call an improvement tracker. One, an improvement is made on the assets. Two, track that improvement. And third, is it performing to the set expectation. Ultimately, the use case is built, made a justification for why that asset needs improvement. Next, did the return-on-investment meet desired expectations? A feedback loop is the last piece of the puzzle because that tells you whether the improvements made are effective or not.
In some cases, the cost might be the easiest measurement. Has the cost gone down? Were production downtime and production losses reduced? The other piece, which often get ignored, is chronic failures. Chronic failures experience the same failure mode repeatedly. At one facility, a coalescer pressure vessel that had a filter continuing to clog because they were passing a lot of sticky material through it. They kept buying new filters and changing out filters every few days. Before they realized it, they spent $600,000 on that asset in a year plus the production downtime to bring the machine down and replace the filter each time. These chronic failures are often ignored, but it's critically important to address those as well.
For more information, visit: ge.com/digital/asset-answers


