1660329098711 Cp 0511 Cryst 3 2

Put crystallization on a solid footing

Nov. 1, 2005
Successful troubleshooting depends on understanding the effects of several key factors.

Ensuring smooth operation of a crystallization process is often considered an art rather than a science. When problems occur — such as the final product fails to meet the target impurity content or the productivity is much lower than expected — few engineers would go back to the fundamental science, such as phase equilibrium and crystallization kinetics, to gain a better understanding of what causes the problem. Indeed, know-how and experience are invaluable in solving such problems, because crystallization is a complex process where many interrelated phenomena are in play. Nonetheless, a systematic analysis can lead to a significant reduction in time and effort for finding a suitable solution compared to trial and error.

Crystallization involves two key steps: formation of solid particles from liquid solution (normally referred to as nucleation), and growth due to the deposition of additional substance on existing particles. The thermodynamic driving force behind both steps is the difference in chemical potential between solution (liquid phase) and crystal (solid phase). In practice, that difference can be represented by supersaturation, which is defined as the difference between the actual concentration of the crystallizing substance in the solution and its saturation concentration. Many textbooks and articles on crystallization begin with this notion and proceed to discuss various topics such as crystallization kinetics and particle size distribution. While an understanding of such issues is critical in analyzing a crystallization process, do not underestimate the importance of solid/liquid equilibrium (SLE).

Clearly, supersaturation can only be quantified if the saturation concentration, often referred to as solubility, is known. Because most industrial systems are multi-component in nature, solubility data of pure components are not enough, as solubility depends on the concentration of all other components present in the mixture. Furthermore, it is important to know which components are supersaturated. This issue is frequently overlooked, partly because crystallization is often considered as a purification technique. However, the presence of seemingly insignificant amounts of impurities in the solution can lead to co-crystallization of both the product and the impurity simply because the impurity is much less soluble than the product. For these reasons, understanding the SLE behavior of the entire system is crucial.

The phase diagram
The SLE behavior of a system can be conveniently represented in a phase diagram that shows the regions of composition, temperature and pressure under which the system would exist as a single phase or a mixture of multiple phases. Because SLE behavior is normally insensitive to pressure, it is common practice to focus only on temperature and composition. Figure 1a shows the SLE phase diagram for a two-component system of o-nitrochlorobenzene (o-NCB) and p-nitrochlorobenzene (p-NCB), which exhibits so-called simple eutectic behavior. A mixture containing 56% o-NCB at 50°C (point 1) exists as a liquid, but when cooled down to 20°C (point 2) it would phase split to give crystals of p-NCB and a liquid solution with a composition indicated by point 3, because the overall composition falls within the two-phase region. On the other hand, another mixture containing 80% o-NCB would yield crystals of o-NCB when cooled down to the same temperature, as this composition would be inside the “o-NCB(s) + Liquid” region. Both mixtures would completely turn into solid if they were cooled down further to reach the “p-NCB(s) + o-NCB(s)” region.

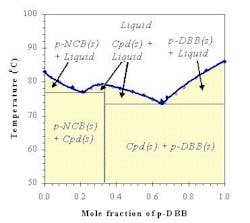
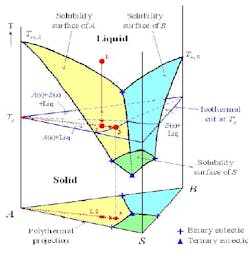
Although this simple eutectic behavior turns out to be the most common for simple organic systems [1], a variety of more complicated behaviors have been observed. For example, the binary system of p-NCB and p-dibromobenzene (p-DBB) exhibits compound formation behavior as shown in Figure 1b. In the “Cpd(s) + Liquid” region, a solid compound consisting of 2 moles of p-NCB and 1 mole of p-DBB is obtained instead of p-NCB or p-DBB. To produce pure components, the temperature and composition must be adjusted to fall within the correct region.The SLE phase diagram for a three-component system takes the shape of a three-dimensional prism with a composition triangle as its base and temperature as the vertical axis (Figure 2). Despite the inherent complexity due to its three-dimensional nature, the diagram still conveys the same idea. When a liquid mixture with a composition given by point 1 is cooled down to temperature Tc (point 2, which lies below the solubility surface of A), crystals of A and a liquid with composition of point 3 are obtained. Such a phase split can be clearly observed on an isothermal cut at Tc (indicated in blue), with point 2 located inside the region of composition at which solid A can be produced at that temperature. A different perspective is given by the polythermal projection (seen at the base of the prism), which is basically a bird’s eye view showing only the regions where a pure solid can be obtained. These regions are often referred to as compartments. Because the projection of point 1 is located within the yellow region, which is the projection of the solubility surface of A, it is easy to tell that A will crystallize out when this mixture is cooled down below the surface. The crystallization process can be conveniently represented on the projection as a movement from point 1 to point 3 away from the A vertex. Naturally, an isothermal cut is preferable if the crystallizer temperature is somewhat fixed, while a polythermal projection is useful to identify the feed compositions from which a pure product can be obtained, without being restricted to a certain temperature.

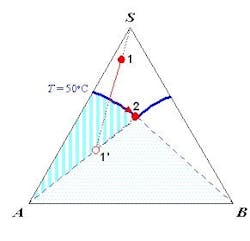
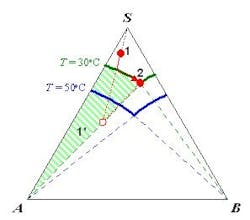
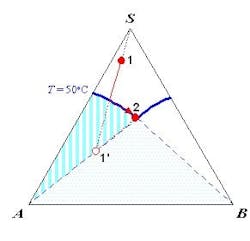
Impact on product purityProcess engineers often face the challenge of fixing operational problems resulting from process modifications such as adoption of a new catalyst, replacement of aging equipment, capacity expansion or retrofitting. The feed composition to the crystallizer may change as a result of those alterations, thus affecting the performance of the crystallization process. Understanding the SLE behavior is often the key to effectively solving such problems, as the following two examples highlight.The first example mimics a real-life case study on the retrofit of an adipic acid plant, which has been simplified for illustration purposes to a problem involving only three components. As shown by the block diagram of the process (Figure 3a), the reactor outlet containing product A, an impurity B and solvent S (stream 1) goes to an evaporative crystallizer operating at 50°C, where sufficiently pure A is obtained as solids. The mother liquor (stream 2) is partially purged, with the remaining portion recycled to the reactor. At a purge ratio (defined as the ratio of the purge stream to the mother liquor) of 1.5%, the locations of the process streams on an isothermal cut at 50°C of the SLE phase diagram are as shown in Figure 3b. The retrofit project is aimed at increasing the overall yield of A. One seemingly obvious solution is to reduce the purge ratio. However, this action would actually increase the impurity content in all streams. Because the overall composition after solvent evaporation (point 1′) is already located at the edge of the blue shaded region where pure A can be obtained, an increase in B content would move it into the two-solid region. Therefore, if the purge rate is decreased, B would crystallize out and contaminate the product. Another possibility to minimize the loss of A is to reduce its concentration in the purge stream, which can be achieved by changing the crystallizer temperature. Comparison of the isothermal cuts at two different temperatures (Figure 3c) shows that, on a solvent-free basis, the double saturation point at 30°C contains less A compared to that at 50°C. Therefore, reducing the crystallizer temperature to 30°C would allow a higher per-pass yield of pure A. But because the recycle stream would now be richer in B, the purge ratio actually has to increase to ensure that point 1′ falls within the correct region. After material balance calculations, it was found that at 7% purge ratio pure A can be produced with a 0.5% improvement in the overall recovery, which represents millions of dollars in savings. The SLE analysis along with material balance calculations helped to avoid problems resulting from the retrofit.

The second example illustrates a purification problem that typifies many in the specialty chemical and pharmaceutical industries. Suppose that a liquid-phase reaction in solvent S yields the desired product P with 90% selectivity, the remaining 10% being byproduct Q. The output from the reactor is sent to a crystallizer to isolate product P. It has been decided to switch to a new catalyst that forms only a negligible amount of byproduct Q. Unfortunately, it produces a small amount of R due to polymerization. Because of  recycle, the concentration of R in the crystallizer feed is about 5%. But, as the overall selectivity to P is 99%, which is significantly higher than for the original catalyst and there has never been any problem with product purity even when the crystallizer feed contains 10% Q, it was decided to go ahead with the switch. However, it was later found that with unaltered crystallization conditions, the solid product contains an intolerable amount of R. The polythermal projection of the SLE phase diagram (Figure 4a) shows why. Because R is a heavy component with high melting point, its solubility in the solvent S is considerably lower than P, leading to a large compartment of R. Therefore, even with a feed that contains a relatively small amount of R (point 1) crystallization of P would soon cause the liquid composition to reach the boundary between P and R compartments. If cooling then is continued beyond point 2, P and R would co-crystallize, making the product no longer pure. Based on this understanding, three solutions might make sense. First, increase the crystallizer temperature so that the liquid composition is still within compartment P (stop the cooling before reaching point 2). Second, add more solvent so that cooling to the same temperature still produces a liquid composition within compartment P (Figure 4b). With both these options, though, the per-pass yield decreases. The third alternative is, of course, to increase the purge ratio so that the crystallizer feed would contain less R. Kinetic and mass transfer effectsEqually important in troubleshooting crystallization problems are kinetic and mass-transfer effects. Even when the SLE behavior indicates that the product should be pure, impurities can be incorporated into the solid product in various ways. One possibility is impurity inclusion, in which the mother liquor containing the solvent and other impurities gets trapped inside the crystal (especially when the crystal grows very fast), thus leading to reduced product purity. Because crystal growth rate depends on supersaturation, inclusion can be minimized by cooling more slowly or adding the right amount of seeds, so that the overall supersaturation level in the crystallizer is kept low. However, it is also important to ensure homogeneity inside the crystallizer, such as by providing better mixing, because stagnant or overcooled spots can produce high local supersaturation that contributes to nearly all impurity inclusion.Another possibility is impurity occlusion, which is caused by either imperfect removal of mother liquor from the solids or adsorption of impurities on the crystal surface. When the crystals are dried, only the solvent is removed and the remaining impurities adhere to the surface the crystals, thus decreasing the purity of the final product. Proper washing and deliquoring is the best solution to minimize this problem for two reasons. First, the “dirty” mother liquor is removed and replaced with a clean solvent, so less impurity goes to the drying step. Second, the introduction of a fresh solvent leads to partial dissolution of the outermost layer of the crystals, thus removing adsorbed impurities on the crystal surface. Washing and deliquoring performance is affected by many factors, such as cake porosity and permeability, liquid viscosity, etc. [2]. The choice of filter type often dictates the extent of possible deliquoring and washing. For example, a rotary vacuum filter has limited area for washing and deliquoring, making it unsuitable for reducing liquid content to very low level. A belt filter may be more appropriate, because it can be designed to have a larger area dedicated to washing.If the impurity occlusion is due to adsorption, the problem can be minimized by producing larger crystals and, thus, lower surface area per unit mass. Larger particles can normally be obtained by reducing supersaturation, because nucleation rate would be slower, thus favoring growth of existing particles rather than formation of new small particles. An alternative solution is to decrease the impurity concentration in the mother liquor, such as by adjusting the purge ratio or the upstream reaction operating conditions. Pinpointing the culpritIt is impossible to distinguish whether a problem is caused by SLE or kinetics just by observing the symptoms. However, it is often possible to single out the cause after a minimum of targeted testing. The first step is to study the SLE phase behavior. At this stage, obtaining a rough idea on the phase diagram frequently suffices. For example, it may be enough to calculate the diagram using the solubility equation [3] and melting point and heat of fusion data from Differential Scanning Calorimetry (DSC) analysis. Experimental data such as solubility and location of double saturation points are then gathered for verification, especially near the boundary, because it is the most important feature to identify.Several techniques are available for determining impurity inclusion or occlusion. Crystals can be analyzed for impurity profile by partially dissolving a sample to different extents. If the impurities are found to penetrate deep inside the crystals, then inclusion is likely. A concentration profile that is roughly proportional to the surface area (diameter squared) may indicate adsorption during crystallization. On the other hand, if the impurities are mainly on the outermost layer, it is likely that occlusion is the key phenomenon. When it is difficult to distinguish between the different mechanisms, it is best to try different remedies based on the possible scenarios.

Build on a solid foundation
Understanding the root of the problem is essential in troubleshooting a crystallization process, because the success in finding the most appropriate solution depends on the ability to identify the underlying phenomenon that causes the symptoms. When product fails to meet purity requirements, crystallization, inclusion and occlusion of impurities are the three mechanisms to be considered. By studying the SLE behavior and testing the impurity profile, it should be possible to identify the responsible mechanism and take a suitable corrective action without much trial and error.

References
1. Matsuoka, M., “Developments in melt crystallization” in “Advances in industrial crystallization,” J. Garside, R.J. Davey and A.G. Jones, eds., Butterworth-Heinemann, Oxford, U.K. (1991).
2. Wakeman, R.J. and E.S. Tarleton, “Filtration: equipment selection, modelling and process simulation,” Elsevier, Oxford, U.K. (1999).
3. Walas, S.M., “Phase equilibria in chemical engineering,” Butterworths, Boston (1985).
4. Tare, J.P. and M.R. Chivate, “Separation of close boiling isomers by adductive and extractive crystallization,” A.I.Ch.E. Symp. Ser. No. 153, 72, p. 95 (1976).
Further Reading
Wibowo, C. and K.M. Ng, “Unified approach for synthesizing crystallization-based separation processes,” A.I.Ch.E. J., 46, p.1,400 (2000).
Wibowo, C. and K.M. Ng, “Workflow for process synthesis and development: crystallization and solids processing,” Ind. Eng. Chem. Res., 41, p. 3,839 (2002).

Christianto Wibowo is a senior engineer at ClearWaterBay Technology, Inc., Walnut, Calif. E-mail him at [email protected].
Sponsored Recommendations

Keys to Improving Safety in Chemical Processes (PDF)

Many facilities handle dangerous processes and products on a daily basis. Keeping everything under control demands well-trained people working with the best equipment.

Get Hands-On Training in Emerson's Interactive Plant Environment

Enhance the training experience and increase retention by training hands-on in Emerson's Interactive Plant Environment. Build skills here so you have them where and when it matters...

Rosemount™ 625IR Fixed Gas Detector (Video)

See how Rosemount™ 625IR Fixed Gas Detector helps keep workers safe with ultra-fast response times to detect hydrocarbon gases before they can create dangerous situations.

Micro Motion 4700 Coriolis Configurable Inputs and Outputs Transmitter

The Micro Motion 4700 Coriolis Transmitter offers a compact C1D1 (Zone 1) housing. Bluetooth and Smart Meter Verification are available.