Automation systems have now reached such a high degree of reliability that many personnel at plants now take them for granted. That is, of course, until people think the readings don’t match their intuition or “gut feel” — then, right away, the instrument is wrong.
The good news is that modern control systems, when linked to asset management tools, have the capability to make things even better. So how can a modern control system make you more competitive, increase the reliability and integrity of your piping and valves, improve maintenance, and help you handle your materials more safely? The answer is by taking advantage of the digital communications possible.
Modern control systems have the advantage over their predecessors of supporting digital communications from the widely used HART protocol, on through the various fieldbuses such as Foundation Fieldbus, Profibus, DeviceNet, LONworks, and AS-I, to name a few. Once a system supports and has installed digital field devices, it is no longer constrained by the single Process Variable (PV) of the analog signal and the need to rely on algorithms in the host Distributed Control System (DCS) to monitor the degree of variability to confirm that the signal is still valid rather than “frozen” at a single point due to some mechanical or electronic malfunction.
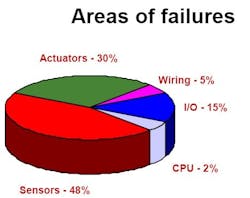
Ironically, one of the ways that has been used to increase system reliability is to install “redundant” control systems. Unfortunately, these systems aren’t nearly as redundant as many people believe, because the redundancy is only from the Input/Output (I/O) cards inward and doesn’t include the field devices.Yet, the I/O and CPU are the most reliable portions of a control system, while the field devices are most prone to failures (Figure 1). Of course, this makes perfect sense since it is the field devices that are exposed to the process and atmosphere, and are physically changing or moving to respond to or control the process. Also as expected, the level of the failures attributed to actuators exceeds their relative proportion among total installed field-control equipment.
Figure 1. Sensors and actuators cause more than three-quarters of control system problems.
Fortunately, fieldbus systems help overcome this challenge in multiple ways — not the least is that, in the case of Foundation Fieldbus with its Link Active Scheduler (LAS) capability, system redundancy now can extend down to the field device level. The LAS provides single loop integrity back to control systems. As a result, it is possible to continue to operate a facility or alternatively determine how it will “gracefully” shut down in the event of loss of communications with the host system.
Fieldbus and the LAS offer a capability common in a pneumatic control loop. As long as the analog input and analog output are on the same physical wire (pneumatic supply in the old days) and one of the devices is LAS capable (local pneumatic controller), it is possible for Foundation Fieldbus to control the loop at a single set point. Of course, should the set point need to be changed, some means is required to do that and normally this is the responsibility of the host system.
All fieldbus systems, including HART, are able to report on the status of the field devices on a regular basis. Most HART installations obtain this information by polling the devices for the data, while true fieldbus systems provide a status bit with every update of the process variable itself. Therefore, the operator will always know if the devices in the control loop are functioning properly.
Of course, the application engineers also should be thinking about how to use this status information to improve the control of the facility through something as simple as verifying that the signals being used for the control algorithms, output signals and multivariate optimization routines are valid.
Maintenance implications
Once it is discovered that a device is operating in a less-than-ideal condition, the next logical step is to use this information to assist with a facility’s maintenance planning activities. Fortunately, almost every host/DCS supplier also offers asset management software tools to effectively and efficiently access not only the status information in the field devices but also an entire range of diagnostic readings. For some devices, nearly 100 different parameters are monitored and available to be reported by the field devices. The limitation is often the power (energy and CPU) available to the device for these analyses. These asset management tools normally reside on a separate dedicated server so that they do not overload the control system with communication and calculation requests that may adversely impact facility operations. While these tools are capable of managing the entire instrument maintenance function, they are normally linked through appropriate security measures such as firewalls to the facility maintenance planning system. This allows for coordination of the work planning for all maintenance disciplines. (It isn’t too often that a valve or field device can be removed without assistance from the pipe fitters or perhaps, in some cases, the electricians.)
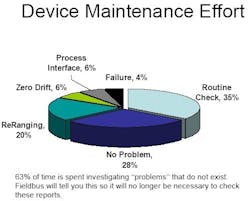
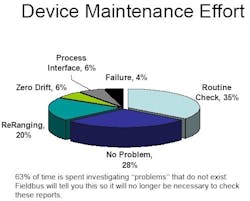
A relatively recent survey indicates that almost two-thirds of instrument maintenance is unnecessary (Figure 2). Integrated digital instruments make it possible to eliminate the “Routine Check” and “No Problem” maintenance requests by either displaying the device status directly on the operator console or alternatively through a mouse click to either a status screen or pop-up with the device’s operating status.
Figure 2. Almost two-thirds of maintenance time is spent investigating “problems” that do not really exist.
In addition, because new field devices are also inherently so reliable and are connected to the host system via digital communications, when maintenance is necessary it is possible to perform as much as 80% of the required work remotely from the appropriate maintenance work station. The “Process Interface” and “Failure” problems (Figure 2) still require that a maintenance mechanic physically work on the device in the field.
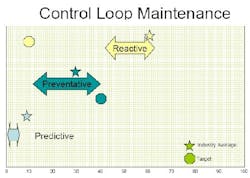
Figure 3, from a presentation by Larry O’Brien of independent research firm Automation Research Corp. (ARC), Dedham, Mass., at 2004 Fieldbus Foundation General Assembly, shows how companies are presently applying the different maintenance techniques to control loops in their facilities against where they think they should be. Corrective maintenance accounts for 60% of efforts versus a target of 10%, with preventative maintenance at 30% instead of a desired 40%. Only 10% of maintenance being performed today is predictive maintenance. Obviously a gap exists and the new capabilities of digital field devices integrated with asset management tools are one way of reducing it.
Economic drivers
ARC indicates that maintenance accounts for 40% of manufacturing cost. Related research has shown that a facility on average spends 10% of its overall maintenance budget on the automation and control system. Therefore if a site could reduce its maintenance expenses, the resulting savings would directly impact the bottom line. How can this be done?
ARC has found that 50% of maintenance is corrective (reactive). In other words, maintenance staff spends half their time involved in emergency or unplanned work. This is the most expensive form of maintenance because any equipment needed must be obtained after the request is received and, if not on hand in the warehouse or inventory, must be express ordered at a premium price. As a result, corrective maintenance is 10 times more costly than preventative maintenance — this is the main reason why most facilities now implement a preventative maintenance program.
Yet, preventative maintenance is done only 25% of the time (Figure 3). Preventative maintenance by its nature seeks to intervene prior to the expected failure date of the equipment. Vendors, to be conservative, add a small margin of error to their estimates. The facility, not wanting to be “caught” either, in many cases “shaves” a bit of time off the recommended maintenance period for insurance or to better coincide with other regular maintenance or unit turnaround/outages. However, the real difficulty with preventative maintenance is that it is time-based, instead of based on the actual condition of the equipment. Typically, 60% of preventative maintenance is unnecessary.
Figure 3. With companies now engaging primarily in corrective maintenance, there’s plenty of opportunity for improvement.
Because of this level of unnecessary work, preventative maintenance is five times more costly than predictive maintenance, which is based on the actual condition of the equipment. However to determine the actual equipment status requires the investment in diagnostic tools and software previously described.
A simple calculation based on the numbers presented shows the return on investment possible:
Assuming a facility has an annual maintenance budget of $1 million, the automation maintenance budget will be $100,000/year. Now, if 50% of this is spent on corrective maintenance instead of the target 10%, there’s a potential savings or opportunity of $40,000 difference between the actual and target as it is unlikely that it will be possible to prevent all corrective maintenance. Because few facilities are implementing predictive maintenance, we can assume that the remaining 50% or $50,000 of the maintenance budget goes for preventative maintenance, versus the target of 40%.
From the 10% difference between the actual and target levels for preventative maintenance there’s an additional maximum potential savings of $10,000. In the best possible scenario, the site reaches both industry targets of 10% corrective maintenance and 40% preventative maintenance. Let’s see what that means financially.
Moving from corrective to preventative maintenance cuts costs by a factor of 10, so the $40,000 expense would shrink to $4,000 if performed as preventative maintenance. The original $50,000 preventative maintenance budget can be reduced by $10,000. As a result the combined opportunity is $14,000/year. Converting that preventative maintenance to predictive maintenance (considering the five-fold difference) will reduce costs to $2,800. Therefore, the overall savings will be $50,000 - $2,800 = $47,200/year/million dollars of maintenance budget. These are simply average values, and each facility will have slightly different levels of maintenance activity in each category. However, the multiplier ratios will remain valid overall and could certainly be used as a first pass estimate of the maintenance savings opportunity at your facility.
Extending the gains
Of course, once the effectiveness of a predictive maintenance program has been demonstrated, efforts will be made to migrate all maintenance to the new program. The already in-place infrastructure of server and asset software will significantly lower the incremental cost of implementation.
In addition, a system with predictive maintenance tools will mean that you’re only working on the items that need to be addressed when they actually require work, thus insuring maximum operational life from your equipment. Less maintenance also translates into reduced risk and exposure to workers as well and, consequently, a safer facility.
A more reliable system isn’t only a lower cost system to operate, it is also inherently a safer system.
I have highlighted how migrating to an integrated control, operations and maintenance solution using a digital communications system can maximize the return on your capital investment while minimizing your maintenance expenditures. All that is required now is to quantify the lifecycle benefits of such a system for your facility.
Ian Verhappen is an ISA Fellow, Certified Automation Professional, adjunct professor at Tri-State University and Fort McMurray, Alberta-based Industrial Networks Director for MTL Instruments Group plc. E-mail him at [email protected].


