Some smart pressure transmitters include built-in diagnostics that can monitor and alarm problems occurring in the process rather than just within the instrument. The best known application of such external-problem diagnostics is detecting impulse-line plugging via differences in the subsonic noise patterns generated between plugged, partially plugged and clear lines. The technique has become well accepted in process automation.
Recent work by Emerson shows that great opportunity exists for spotting many more process problems via acoustic signatures using the latest fast-sampling pressure transmitters. We have evaluated noise phenomena in a range of process equipment at customer sites, university R&D facilities and private laboratories to detect incipient and actual process problems or failures. Of particular interest is work in
1. Catalyst circulation in fluid catalytic crackers;
2. Pulsation-induced measurement error;
3. Coated or plugged multiport pitot-tube (Annubar) flow meters;
4. Coal-pulverizer fan wear (somewhat afield of chemical processes);
5. Distillation column flooding;
6. Furnace/boiler flame instability; and
7. Wet gas flow.
The first four have been proven and are being used in a few chemical plants and elsewhere.
For instance, an Exxon refinery relies on process noise detected by a fast-sampling pressure transmitter to quickly alarm the beginnings of stick-slip catalyst flow in a fluid catalytic cracker. In the past, the automation system's historian was about 30 minutes late at conventional regulatory sensor-sampling rates in noting the problem and alarming the tag. This resulted in shutdowns that cost up to $1 million/day in lost output for up to seven days, plus very expensive equipment repairs. More details on the application are at:
http://www.emersonprocess.com/rosemount/document/notes/00830-0200-4801.pdf
The other three applications are in various stages of advanced development. Less far along is problem detection in aerated liquid flow, agitation, bubbler tank level, process leaks and pump/valve cavitation. Theoretical applications include steam trap failure, turbine blade wear and coating, and wet steam flow.
Today we know what factors must be present for a reasonable chance of success in both detection and application of process noise to reveal and control process problems.
KEY COMPONENT
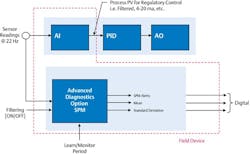
Vital to detecting problems or failures in process equipment are HART 4–20-mA and Foundation Fieldbus pressure transmitters having fast-sampled (22-Hz) sub-sonic sensor readings (Figure 1). These signals are used two ways: (1) conversion to filtered process variable for regulatory control, and (2) conversion of noise hash into useful acoustic signatures within an on-board advanced diagnostics module based on statistical process control (SPC). Data provided by this module are trailing mean, trailing standard deviation (SD) and calculated coefficient of variation (Cv). These three values and the relationships among them — often at particular sensor-reading frequencies — can expose incipient and actual problems before they otherwise would be noted.
The 22-Hz sampling rate is useful for evaluating about 80% of the noise frequencies commonly generated by the large and heavy equipment and relatively slow events found in processes. Unfortunately, per the Nyquist sampling theorem, frequencies from 0 to 11 Hz (22 Hz halved) are the only ones available for evaluation. Above 11 Hz, frequency aliasing leads to garbled information.
HELPFUL NOISE
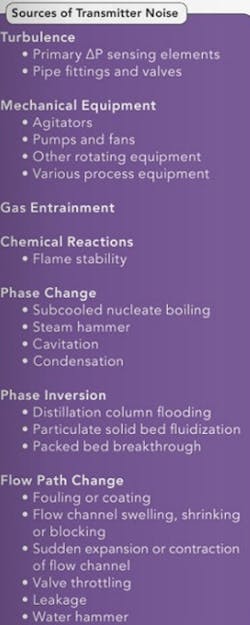
Table 1 lists sources of process noise found useful thus far. Of these, turbulence is most common. Such sources probably are self-evident, except perhaps for burner flame instability, which indicates incorrect air/fuel ratio or impending flame-out in furnaces and boilers.
Trying to identify the source or sources of noise at the beginning of a smart pressure transmitter problem-sensing application project is helpful. However, rigorous analysis isn't worth the time and effort. For example, noise reflected off internal surfaces can alternately reinforce or cancel itself out, depending upon conditions, thereby confusing analyses. Also, the more viscous a fluid is, the more it absorbs sound, which makes transmitter or testing equipment placement a guessing game.
It's best to attempt to identify generally expected trends of what the signal source is doing at any one time versus what the process is doing then or might do later. Detecting an incipient problem or failure is the ultimate goal. Thinking ahead helps speed the development of a testable hypothesis that can be instrumented-up and trended during normal and abnormal operations. It's all quite empirical.
Three signal phenomena deserve particular attention.
Most obvious is a signal that gets stronger or weaker because of an abnormal situation. Impulse line plugging and distillation column flooding (discussed later) fall into this category. The faster the change occurs, the more positive the detection.
Second is where signal strength fluctuates more (or less) during abnormal conditions. Changes in mean and SD make those occurrences stand out graphically.
Less obvious is where the diagnostic signal is simply background process noise, such as from a pump or blower, and of no value of itself. Process-problem detection occurs when this signal, as it passes through a piece of process equipment, is attenuated or amplified during an abnormal situation. Noteworthy examples include: fouling in a heat exchanger and water absorption in a molecular sieve dryer (a swelling sieve changes the flow channel, which muffles the background noise).
BEST PRACTICES
In addition to trying to identify the source or sources of process-generated noise, an engineer should evaluate the physics of the noise through statistical manipulation to help develop a testable hypothesis.
For instance, in a fluid flow situation it's useful to know what the physics of the fluid are (its Reynolds Number (Re), viscosity, density, etc.), and their impact on noise creation, propagation and suppression — and therefore on transmitter positioning. The same can be said about the effects — good or bad — of orifice plates, venturis, valves and other substantial noise generators.
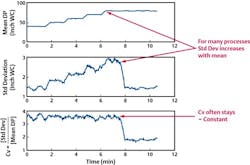
As a statistical example, a higher flow rate equals higher Re, equals higher turbulence, equals higher SD. Frequently, the SD increases and decreases quite linearly with flow rate. Dividing the SD by the mean (which gives the Cv), in effect, filters the SD by providing a Cv trend curve that stays relatively level compared to a rising and falling SD trend (Figure 2). Under abnormal conditions, the typically abrupt change in the Cv trend is often the most easily detected and alarmed.
The transmitter, of course, should be located close to the expected diagnostic signal source and far from interfering signal sources. Its impulse lines should be short and purged often. Once the transmitter is in service, it's important to check whether new or intermittently operating process equipment generate noise in the 0–11 Hz range. If so, the transmitter may need retuning for proper operation.
Many more suggestions, tips, do's and don'ts, and the like gained from practical experience exist — more than can be covered in a short article.
COLUMN FLOODING
Let's now look at some of the thought processes in recent work to spot distillation column flooding.
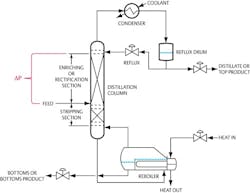
A smart ΔP transmitter used to monitor and control upward vapor flow in the rectification section of a packed distillation column also can serve to detect and alarm, via its noise signature, incipient flooding in that section (Figure 3). The diagnostic technique was developed and proven on a pilot-plant column of the Separations Research Program at the University of Texas at Austin. (See: "Technology Targets Towers.") It hasn't yet been applied to a full-size tower.
When operating normally in the section's continuous phase, droplets of distilled product fall through the packing while vapor flows upward. Increasing vapor flow creates an aerodynamic drag on the droplets. If drag becomes excessive, the drops can't fall and flooding begins.
Eventually a complete phase inversion occurs; the void space is flooded entirely with a combination of liquid and entrained vapor bubbles being forced up through the liquid. In due course the transmitter's regulatory function would sense a substantial increase in ΔP due to flooding throughout and trigger an alarm — but much too late.
The transmitter's diagnostics are configured to detect a change in the emitted noise pattern from the flooded packing caused by the sound of the bubbles randomly nucleating, growing and breaking — not unlike the noise of a carbonated drink.
Figure 4 shows a SD curve of the transmitter's bubble noise signal, modified by an SPC differencing filter, that indicates a relatively sharp increase before settling at a higher level. The one-minute trailing trace is the most graphic indication of the beginning of flooding and the ideal parameter to alarm.
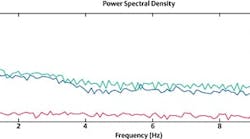
A power spectral density analysis can refine the sensing technique and check possible interference with the transmitter's regulatory function. Figure 5 shows bubble noise during normal and flooded conditions. Note that from 4 to 11 Hz the normal trace runs as much as 10 db quieter than the flooded one, making that range best for flooding detection. Also note that the two traces are quite flat and unspiked, indicating they are "weak white noise," i.e., noise that minimally affects the accuracy, reliability and repeatability of the regulatory signal.
LISTEN TO YOUR PROCESS
Smart fast-sampling pressure transmitters can break apart what appears to be random process noise. What's discovered within that noise can identify process problems. While I highlighted early detection of distillation column flooding, a variety of potential applications exist. Each differs in its own way. Additional statistical analysis methods can manipulate process signals to tease out otherwise unknown phenomena and also to establish trailing-mean learn/monitor periods to give the most consistent results.
ROGER K. PIHLAJA is principal engineer — process diagnostics for Rosemount, Emerson Process Management, Chanhassen, MN. E-mail him at [email protected].
