Texas A&M University’s Industrial Assessment Center (IAC) recently assessed a manufacturing plant and discovered savings of $127,000/y in correcting power factor (PF) on the site’s electric service. Do you understand how PF affects your electric bills? If you don’t, don’t feel bad —probably 99% of plant managers I ask that question answer back with a blank stare! A low PF dramatically increases your billed demand.
Total apparent power in electric circuits is the sum of the “real power” and “reactive power,” as total power = real power + reactive power. Real power is able to do work, measured in kW. The reactive power is consumed in energizing a magnetic field, denoted as kVAR. Electric motors are the main users of reactive power, because of the magnetic field generated in their windings. The PF is the ratio of the real power (Pr) to the apparent power (Pa), or PF = Pr /Pa.
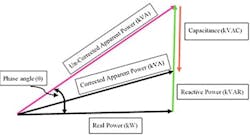
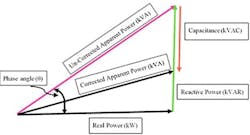
Real power and reactive power are 90° out of phase, so they have both magnitude and direction — i.e., they are vector quantities. Their vector sum is the total apparent power, denoted as kVA. We illustrate this as the PF triangle shown in Figure 1.
Figure 1. Simple trigonometry can be used to determine power factor.
The beauty of using the PF triangle is that the standard trigonometric relations (sine, cosine, etc.) enable you to solve the elements of the triangle given the minimal information of any right triangle. The PF is equal to the cosine of the phase angle.
As discussed in my previous column (see, “Learn from Your Electric Bills, Part 1”), most electric companies bill industrial customers both for energy used (kWh), and for demand (rate of energy used, kW). PF can affect the billed demand, although the energy delivery companies in Texas have several different ways of handling this. Some bill on total apparent power (kVA), so any increase in PF reduces the bill. Others specify a minimum PF (PFmin) in their rate tariffs. If the actual power factor (PFactual) exceeds the minimum, billed demand will equal actual demand — i.e., the real power (kW). If PF is less, the formula used to set the billed demand is
Billed demand = actual demand × (PFmin ÷ PFactual)
With a PFmin of 0.95 and a PFactual of 0.75, this calculation gives a ratio of 1.267. This means your billed demand is 26.7% more than your actual demand.
Installing a capacitor bank will increase the PF. The capacitors function exactly opposite to the reactive power vector, reducing the total reactive power and the phase angle, and shortening the apparent power vector as seen in Figure 1.
Using the geometry of the PF triangle, we can readily calculate the impact of a capacitor bank, and the resulting demand savings in an electric bill. This is how the IAC determined the savings for the plant mentioned in the first paragraph. Appendix 1 (see below) contains a detailed calculation of a similar example.
Now, find 12 months of your electric bills and discover the savings for PF correction at your site!
JIM EGGEBRECHT, PE, is a guest contributor. You can email him at [email protected]
Editor’s note: This article was written by a colleague of our regular columnist, Alan Rossiter. Jim Eggebrecht, PE has worked at the Industrial Assessment Center (IAC) at Texas A&M University in College Station, Texas for over 27 years as the assistant director. The IAC is a national program of the U. S. Department of Energy’s Advanced Manufacturing Office. Eggebrecht has completed over 450 energy assessments for a range of manufacturing facilities. He is also the executive director of the Industrial Energy Technology Conference, hosted by the Texas A&M Engineering Experiment Station, the Texas State Energy Conservation Office, and the Louisiana Department of Natural Resources.
The following calculations use data for one month, showing how to determine the savings and the required correction, in kVAC, with the capacitor bank. A billed demand of 1,080 kW, PFactual of 0.82, and PFmin of 0.95 are assumed.
The first calculation to find the actual demand kW uses the billed demand formula in the main text, re-arranged to solve for actual demand:
Actual demand (kW) = 1,080 kW ÷ (PFmin ÷ PFactual) = 1,080 kW ÷ (0.95÷0.82) = 932 kW
So once the PF is corrected, the new billed demand will be 932 kW. The savings for billed demand is 1,080 kW - 932 kW, or 148 kW.
We then determine the uncorrected phase angle and reactive power values in the triangle.
Phase angle = arc cosine (0.82) = 35°
Reactive power (kVAR) = (tangent 35°) × 932 kW = 651 kVAR
When the capacitors are sized to make the PF = 0.95, the phase angle will be 18°, and the reactive power is 306 kVAR. The difference between the original reactive power and the corrected value is the result of adding capacitors.
651 kVAR - 306 kVAR = 345 kVAC
Assuming a common value of $8.00/kWmo for total demand cost, the cost savings from PF correction would be
148 kW × 12 mo/yr × $8.00/kWmo = $14,208/year
The plant featured in the first paragraph of the main text had demand 7 times larger than this example, a power factor of 0.84, and a demand cost of $9.68/kWmo.

