After a promising start, the global economy faltered in 2014 because of heightened geopolitical uncertainty, recessions in Brazil, Japan and many European nations, as well as slowdowns in China, some countries in the European Union and elsewhere. So, the manufacturing sector, which represents the primary customer base for chemicals, entered a soft period in 2014, with particular weakness in Europe and East Asia. However, the global industrial cycle is beginning to turn upwards, led by the United States, the United Kingdom and other nations. Moreover, both supportive monetary policy around the world and virtually non-existent inflationary pressures bolster the trend.
In the United States, the economy is growing but below its potential as high taxes, debt and regulatory burdens still take a toll on both business and consumer confidence. As a result, businesses have been cautious and will slow capital spending in 2015. Furthermore, overseas weakness and a higher dollar dampen U.S. exports. With household deleveraging over, further improvements in the employment situation, lower oil prices fostering discretionary income and asset prices moving higher are prompting consumers to start to spend again.
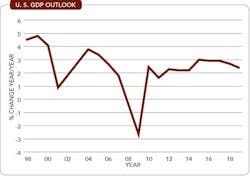
Overall, growth in the U.S. economy will continue into 2015. We can see this by examining the trends in the Chemical Activity Barometer (CAB) from the American Chemistry Council (ACC). The CAB is a composite index of economic indicators that tracks the activity of the chemical industry. Due to its early position in the supply chain, chemical industry activity leads that of the overall economy and, thus, the CAB can be used to anticipate potential turning points in the overall economy. The CAB currently is signaling slow economic growth into 2015. Indeed, the consensus forecast for U.S. gross domestic product (GDP) is for continued but modest growth in 2015 at around the historic trend of about 3.0% (Figure 1). This likely will ease slightly in 2016 and beyond but will be a pace stronger than that experienced in the recovery/expansion thus far. In addition, the United States is in the midst of an unconventional oil and gas boom, which is spurring economic growth and industrial activity. However, long-term growth in the economy will be more muted due to demographic, policy and other factors.
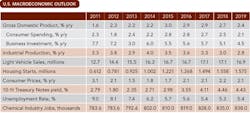
Table 1 summarizes the macroeconomic outlook for the United States.
Most key end-use markets for chemicals have recovered; however, several segments remain below their pre-recession peaks. During 2014, manufacturing growth improved. Leaders included light vehicles, appliances, construction materials and some industries involved with business investment. However, several other manufacturing industries (textiles, paper, printing, etc.) have yet to regain traction. Forward momentum for these segments depends upon demand for consumer goods, which ultimately drives factory output. In addition, the surge in unconventional oil and gas development is creating opportunities both on the demand side (e.g., pipe mills, oilfield machinery) and the supply-side (e.g., chemicals, fertilizers, direct iron reduction).
Light vehicles represent an important market for chemicals (nearly $3,500 per vehicle) and production continues to improve (Table 1). U.S. light vehicle sales are expected to rise further in 2015 as pent-up demand, improving employment (and income) prospects, and better availability of credit foster growth.
Housing is the other large consumer of chemicals (about $15,000 per start) and the outlook there is still cautious. Inventories are low as are interest rates, and better job growth eventually will lead to increased formation of households, the prime long-term driver for housing. That said, housing price gains have stalled, demographic headwinds remain in place, preferences are shifting for types of housing, and finances remain weak among many potential first-time buyers. A gain in housing starts is expected in 2015 and 2016 (Table 1). Activity will remain well below the previous peak of 2.07 million units in 2005 — but by the second half of the decade, activity will approach the long-term underlying demand of 1.5 million units per year as suggested by demographics and replacement needs.
Effective inventory management since the end of the Great Recession has resulted in fairly-well-balanced inventories relative to shipments. Along the value chain downstream, businesses are reluctant to add to inventories and, as a result, levels are low. Downstream customers have been optimizing inventories. Inventories among chemical wholesalers have been mixed in recent months.
Despite the slowdown in global manufacturing, the gains in U.S. chemicals volume have ratcheted up. With an improvement in customer industries and eventually in emerging markets, the effects of an enhanced competitive position with regard to feedstock costs will support U.S. chemical industry production going forward.
For the U.S. chemical industry, the softening of the manufacturing recovery dampened domestic chemical demand while the recession in Europe and weakness elsewhere have hindered export sales, which normally would be aided by a favorable oil-to-gas price ratio. During 2015, ACC expects trade in chemicals to continue to expand at moderate rates as global manufacturing activity improves. Trade deficits will remain centered in pharmaceuticals and agricultural chemicals but will be partially offset by large (and growing) surpluses in basic and specialty chemicals.
Basic chemicals (inorganic chemicals, petrochemicals, plastic resins, synthetic rubber and man-made fibers) were the hardest hit from the recession in Japan, Brazil, etc. and the economic slowdown in other nations, despite improving demand from important customer markets such as light vehicles and housing. Downstream customers still remain cautious about building inventories but improvements in final demand could necessitate replenishing.
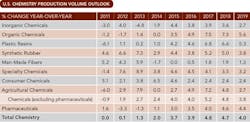
U.S. chemical production only rose 0.1% in volume in 2012, 1.3% in 2013, and 2.0% in 2014 (Table 2). The consensus is that output will increase 3.7% during 2015 and continue to rise for the next several years. Strong growth is expected in inorganic and organic chemicals, plastic resins, and synthetic rubber as export markets revive and domestic end-use markets further improve. Production of specialty chemicals will be driven by strong demand from end-use markets — most notably light vehicles and housing. Strong 2014 gains in consumer products will moderate in 2015 and 2016. Demand for agricultural chemicals (and their supply from the U.S.) will revive. During the second half of the decade, U.S. chemicals growth is expected to expand at over 4% per year on average, exceeding the rate of the overall U.S. economy. Aided by an aging population, pharmaceuticals eventually will emerge as a growth segment towards the end of the decade.
Although projected year-over-year growth rates for most segments appear strong over the next few years, they must be considered in the context of the exceptionally sharp declines seen in 2008 that continued into 2009.
Looking forward, the expected modest gains in chemical industry production volumes and stable capacity suggest improving operating rates in 2015, and with strengthening production volumes, capacity utilization could improve even further in 2016 and beyond.
THE IMPACT OF GAS
Access to vast, new supplies of natural gas has created an enormous competitive advantage for the American chemical industry and petrochemical manufacturers in particular. Investment has rapidly risen, driven strongly by significant expansion of existing petrochemical capacity. As a result, capital spending surged 11.8% to $33.3 billion in 2014. Despite the hindrance of slow global growth, uncertainty and U.S. tax policies that discourage business investment, these strong gains in capital spending for the American chemical industry are expected to continue. Capital spending should increase more than 9% per year on average through 2017 with only a minor slowdown in growth after that. Expansions will continue and investments to improve operating efficiencies will play a role as well. By 2019, U.S. capital spending by the chemical industry will reach $48.6 billion — more than double the level of spending at the start of this prolonged cycle in 2009.
High profit margins, a low cost of capital and the opportunities afforded by shale gas will help spur prodigious increases in new plant and equipment investment. The United States is being favorably re-evaluated as an investment location and petrochemical producers are announcing significant expansions of U.S. capacity, reversing a decade-long decline. It’s estimated that the gains to basic olefins capacity range from 35% to 40%. Indeed, over 215 new chemical production projects (valued at over $135 billion altogether) have been announced through early-December and the dynamics for sustained capital investment are in place.
Access to plentiful and affordable natural gas supplies is allowing the United States to capture an increasing share of global chemical industry investment. This trend will continue as the United States has become the location for investment.
While strength in American manufacturing, improvement in labor markets and growth in key end-use markets have translated to solid domestic demand for chemicals, weakness in external markets has limited U.S. chemical export sales. Despite the attractive competitive position American chemical production offers from a comparably favorable oil-to-gas price ratio, trouble in the economies of major trading partners means that the industry likely won’t post a trade surplus until 2017. After that point, it should become a net exporter over the longer-term.
Considering chemicals trade excluding pharmaceuticals, the United States is a net exporter. By this measure, the industry will post a trade surplus of $39 billion this year, reflecting a $33 billion surplus in basic chemicals. As new investments in the chemical industry come online, basic chemicals export growth will accelerate. Excluding pharmaceuticals, the surplus in chemicals trade will grow to $77.4 billion by 2019.
POSITIVE MOMENTUM
With the start of a new year, the chemical industry is building momentum. Continued recovery in end-use markets, a shift in competitiveness and the eventual return of global economic growth will lift demand for American chemicals over the next several years. Inventories remain balanced, so increasing demand for chemicals will come from new production rather than stock drawdowns. ACC expects to see above-trend growth in basic chemicals over the forecast horizon, in addition to solid demand in other segments.
Innovation also will continue to drive the American chemical industry, with growing investments in research and development in new molecules, new applications, and new more-efficient processing techniques. Studying the safety of chemical products also continues to be a significant part of companies’ research programs.
With the development of shale gas and the surge in natural gas liquids supply, the United States has moved from being a high-cost producer of key petrochemicals and resins to among the lowest-cost producers globally. This shift in competitiveness is boosting export demand and driving significant flows of new capital investment toward the United States. Recently announced new capacity for chemicals will significantly expand production when those investments come online beginning in 2015. As a result, employment in the chemical industry will pick up. By 2019, employment will reach 838,000, up from 792,600 in 2013. Due to an aging workforce, the actual hiring needs will be much larger. We’ll also see U.S. chemical exports grow and, as external demand becomes more robust, we’ll see the recent pattern of trade deficits shift to one of net surplus. By 2019, the American chemical industry will post record trade surpluses.
THOMAS KEVIN SWIFT is chief economist and managing director of the American Chemistry Council, Washington, D.C. E-mail him at [email protected]


