The chemical industry is finally seeing better volume growth and tightening capacity. Eventually, there will be opportunities to raise prices. Yet, rapidly increasing raw material costs, increased competition and continued commoditization of specialty products across the industry are forcing chemical producers to look beyond standard practices; cost cutting and pricing programs will not significantly improve profits. They are discovering that they need to better tools to help them capitalize on the products and maximize profits — to generate cash faster. They need a new metric: the Return on Assets (ROA).
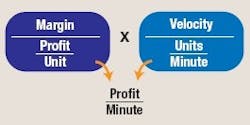
ROA is perhaps the most important measure of profitability for shareholders (Figure 1).
Figure 1. Like a vector, ROA is a multiplication of a magnitude and a direction.
It represents how much cash has been generated during the course of a year (or quarter) with the huge investment in manufacturing facilities. Typically reported as a percentage, ROA is in reality a measure of profit over time that is calculated by adding up the margin-based profits attained by all the company products during the year and dividing this number by the value of the asset base.
There is a problem with the margin-only approach to profitability. First of all, maximizing margin is typically the focus of the sales and marketing teams whereas production concentrates on making products faster — improving production speeds, efficiency, yields, etc. As a result, production tends to have little say about which products are made in the first place, although they know very well which ones run best through manufacturing facilities. As a result, marketing and production are looking at two different metrics when evaluating products as “good” or “bad.” No common ground exists for making key product decisions.
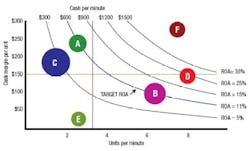
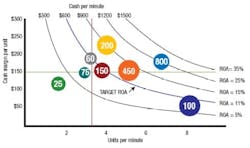
A very real danger exists in focusing on margin alone and not considering production speeds. Consider product A, which has a margin of $10 per kg and product B, which has a margin of $7 per kg. Looking solely at margin, product A appears to be the more profitable of the two. However, if 1 million kg of A are produced in a year as opposed to 1.5 million kg of B, product A will generate $10 million in profit and product B $10.5 million. Incorporating the production velocity of each product gives a completely different ranking for profitability when compared to the margin-only approach. Another example of the danger of over-simplification is shown in Figure 2.
Figure 2. Although product C and A have similar margins, their ROAs widely differ.
It is evident that efforts to maximize profitability based on margin alone will not optimize the ROA.
Finding a common language
Combining margin and production velocity data produces a metric — profit per minute — that is analogous to the ROA, since, unlike margin alone, it is time-based. Looking at profit-per-minute at a product level is, therefore, really looking at the ROA at a granular level. Using profit-per-minute as a guide for operational decisions would ensure that the ROA for the company at the end of the year is truly optimized. It would constitute an operational link that would allow the overall company ROA to be managed proactively, rather than being a “rear-view mirror” metric of profits the company achieved.
So why haven’t companies adopted this approach? The simple two-product example above would be easy for a company to calculate. But what happens when a company makes thousands of products in numerous plants and sells them to hundreds of customers? The calculations are no longer easy. With the focus on margin due to the evolution of accounting systems, companies have settled for margin as the best proxy for profitability.
The margin-only focus creates other problems besides sub-optimal profitability. Sales and marketing departments focus on margin as the best measure of profitability available to them, while production focuses on the amount of product made per unit of time. This creates an environment where each department has a different measure for which is the “best” product. Sales and marketing will direct initiatives toward higher-margin products that may seem like “poor” products to production due to their slow production rates. The profit-per-minute approach enables, for the first time, production and sales teams to speak a common language that aligns them toward producing and selling products that generate higher profits.
From theory to practice
While the profit-per-minute theory seems logical, the true litmus test is how the approach works in practice. In other words, how does profit per minute affect day-to-day operational decisions? With insight into the never-before-used profit-per-minute metric, manufacturers can now make decisions about plant profitability, alternative routings, capacity planning, capacity loading, lot size profitability, and can quantify and tie downtime and yield losses directly to what shareholders want the most: ROA, and ultimately profitability. This method can be applied to measuring plant profitability, identifying where best to invest, estimating line efficiencies, and optimal lot sizes and, thereby, plant and line capacities.
Many chemical companies produce similar products at multiple plants. When profitability is viewed from a detailed profit-per-minute viewpoint, one plant may seem to generate more profits than another plant, even though the products produced are similar or even identical. Obviously a plant’s age, energy costs, raw material costs, personnel rates and personnel abilities may contribute to such a scenario. Knowing the differences in plant profitability enables production management to focus attention on possible improvements for less profitable facilities. Are capital improvements needed? Is maintenance sufficient? Does the production team need more training? Is the plant not well-suited for making certain current products?
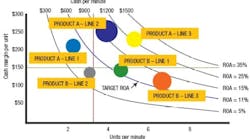
In line with an analysis of plant profitability, a similar analysis of product profitability by production line may offer further possibilities for profit optimization. Certain products may run better, i.e., be produced at faster production speeds on one production line than on another. Knowing differences in profitability for a given product by production line allows the production team to consider potential causes and actions. One possibility might be to switch a product to another production line where it runs faster or with better yields and less downtime (Figure 3).
Figure 3. Comparing products and lines is crucial in maximizing plant and company profits.
Perhaps another product could run more efficiently on the production line in question. Routings of products to production lines where they generate the most cash-per-minute is a significant benefit from a profit-per-minute approach to profitability.
Producing chemicals in larger lot sizes would seem to be a logic means of increasing a product’s profitability by reducing set-up times. However, without knowing in detail the differences, if any, in profitability for a product by lot size, it is impossible to schedule product batches in way that will maximize profits. If there are not significant differences in profitability for different lot sizes, the production team might decide to schedule smaller lot sizes in order to meet demand for spot market products.
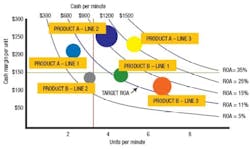
On the other hand, large differences in cash-per-minute with varying lot sizes might direct the production team to increase pricing for smaller lot sizes for certain products in order to increase their profitability. Again, without knowing product profitability at a granular profit-per-minute level, it is impossible to even know that one should be looking at these types of production decisions (Figure 4).
Figure 4. Efficiency of production is not always improved with bigger lots.
The ability to rank products on profitability by plant and production line opens up the possibility of quantifying downtime and losses in yield by product. If downtime or yield is worse than average for a given product, efforts can be made to investigate the causes. Does a product just not run well on a given production line? Is maintenance needed on that production line? Are capital improvements or replacements in equipment needed? Without knowing product profitability at this detailed level, the production team would not even know the need to ask these questions.
Once product profitability is known by plant, production line, lot size and non-production dimensions such as customer and geography, then decisions may be made to consider reducing the demand for certain products or even killing off others. The detailed view of profitability provided by the profit-per-minute approach may lead to major changes in product, customer and asset mix. As a result, capacity planning and loading of production facilities might be significantly impacted. For example, if a particular product is found to have very low profitability, sales and marketing, and production may jointly decide to stop making it and use the freed-up capacity to make more of a more profitable product.
If existing capacity among all plants is insufficient to produce more of a very profitable product, a decision might need to be made to add a new production line, or build or acquire a new plant. If a particular production line is old and in need of upgrades, a decision will need to made how to load other production lines while upgrade work is done on the poorly performing one.
If, as discussed earlier, changes in production lot size should be made to increase overall profitability, decisions can be made in the scheduling and loading of all company production facilities.
Effectively managing profit
As seen in the sidebar, product decisions can dramatically differ when based on profit per minute — the operational equivalent of ROA — rather than on margin alone. With this insight, we can readily see how the use of ROA at an operational level can have significant impact in deciding which products to make, where to make them and what to charge for them.
From a production perspective, an operational ROA view impacts decisions in areas such as productivity improvement initiatives, capital investment decisions and plant maintenance. Thus, using a profit-per-minute approach, makes it possible to base every day product-level operating decisions on ROA rather than on margin alone. The net result, as we have shown, is that production, sales, marketing and finance have a common platform that can be used to maximize overall company ROA.
Richard Batty is director of product marketing at Maxager Technology in San Rafael, Calif.; email him at [email protected].
