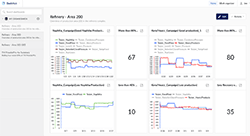
TrendMiner NV, a Software AG company and provider of self-service advanced analytics software, releases its second software update of 2019, TrendMiner 2019.R2. The release introduces DashHub, a new dashboard and reporting module that reportedly provides actionable, visual representation of operational performance data. The 2019.R2 release also includes many new features and enhancements based on user feedback, according to the company.
TrendMiner enables process and asset experts to analyze, monitor and predict operational performance through trend analysis of time-series data. Multiple trend views, in combination with specific views of contextual operational performance data, can now be presented via DashHub. Process behaviors related to specific KPIs can be monitored, and trends of key sensor data can be viewed in a quick and convenient way, enabling rapid detection of root causes that can lead to actionable intelligence when issues or losses occur, according to the comapny.
The user can easily switch between available dashboards or quickly create new dashboards with trend or context item tiles. In addition to the notifications users can receive based on monitors they have created, dashboards can be used to assess operational performance and prioritize which parts of their process require special attention. From DashHub, users can directly investigate process anomalies, production losses or equipment inefficiencies.
DashHub also provides users with greater flexibility. The recently introduced ContextHub brought users the ability to get a full 360 view of their manufacturing processes by unlocking all operational events stored in third party systems. Users can now easily jump between the graphical views of TrendHub and the contextual views of ContextHub at will. Context items can be visualized directly within their respective trend views, and conversely, context items in ContextHub can be used to directly access their respective trend views with a simple push of a button.


