Sounding out the health of your plant has in the past been akin to visiting your own doctor. Its something that absolutely needs to be done when suspicious symptoms start to show, but more normally is reserved for routine visits when regular check-ups are due.
These days, however, your plant comes ready equipped with its own team of doctors in the shape of the many diagnostic and monitoring systems incorporated into instrumentation and other process equipment. And, like any good doctor, todays plant diagnostics can look beyond the symptoms of poorly performing instruments and provide insights into the health of the process itself.
Diagnostic and monitoring systems have been available for many years, of course, but generally were applied in something of a piecemeal way, protecting process-critical pieces of plant and equipment rather than offering a systemic view of the process. However, the widespread adoption of digital automation and fieldbus networks now has opened the door to much more powerful and advanced levels of diagnostics.
There is a lot of activity in diagnostics in general, and certain areas in particular, notes Eddie Bridges, international product group manager with instrument maker Krohne, Peabody, Mass. Mounting pressure from end users certainly is spurring developments, he adds. NAMUR [the international association of users of process control technology in the chemical and pharmaceutical industries] has been pushing manufacturers into providing more information from the electronics in flowmeters, for example.
Plants want more diagnostics, agrees Paul Schmeling, senior marketing manager for Rosemount Pressure Products, Chanhassen, Minn., a part of Emerson Process Management. This has been a popular message with customers, who are trying to do a lot more with their instrumentation. We have a lot of engineers working on this right now, both at the device level as well as the wider system loop level. One result is its ASP Diagnostics Suite.
Making sound use of noise
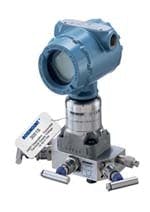
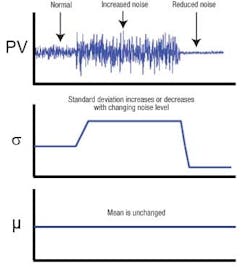
Now embedded in the Rosemount 3051S series of pressure transmitters (Figure 1), ASP uses a basic principle known as Statistical Process Monitoring (SPM) and relies on the fact that virtually all dynamic processes have distinctive noise characteristics and that any significant changes in that noise can indicate that something is happening in the process or equipment (Figure 2).
Figure 1. Statistical Process Monitoring software in this pressure transmitter enables detection of plugged impulse lines and provides other diagnostics.
The problem, however, has been in detecting and monitoring those changes. Typical process control systems generally filter out high frequency noise to improve the signal-to-noise ratio and only can read transmitter outputs every second or so. This is fast enough for most process control but its considerably slower than the speed at which many instrument sensors are actually receiving signals from the process. The 3051S, for instance, samples its process variable 22 times per second, says Schmeling. The high speed of the device together with the internal calculation of statistical parameters are key to the SPM technology.
The patented software resides on a diagnostics feature board mounted in the transmitter head and computes the mean and standard deviation of the input signals. SPM features a learning module that establishes baseline values that are considered normal for the process and installation. These values are constantly compared to the current values of the mean and standard deviation and then, based on sensitivity and user-selected settings, the SPM diagnostic can generate alarms, alerts or other action when a significant change is detected in either value.
For instance, if impulse lines to the pressure transmitter are plugged, the transmitter output may appear normal (because its effectively continuing to read the pressure at the time of the plug) and the mean will remain unchanged. However, Emersons research has shown that in a typical flow application the standard deviation at a given flow rate changes significantly if one or both impulse lines are plugged. The SPM diagnostics will pick this up, alerting the operator to the abnormal situation.
Figure 2. The effect of changing noise levels on the mean and standard deviation values for a process signal can help identify problems.
All the diagnostic information generated from the SPM-equipped 3051S now can be viewed through an enhanced EDDL-based graphical user interface much better than just showing numbers in a box, notes Schmeling.
ABB, Houston, also is keenly interested in improving the diagnostics of its instrumentation. The company is in continuous discussion with customers and end user groups to determine new sensor technology requirements for each product line, says Sean Keeping, vice president technology for ABB Instrumentation, St. Neots, U.K. The focus is on transforming the sensor data into value added information.
As one example, he cites the FSM4000 electromagnetic flowmeter, which employs a diagnostic coil to actively adjust the zero and eliminate any line noise. It effectively measures 100% of the useful signal and is said to deliver a higher signal-to-noise ratio than other systems. Keeping says the company also has patented a concept for in-situ validation of magmeters. The CalMaster 2 and CheckMaster products connect to the flowmeters and run a series of tests to verify their accuracy and repeatability against the original factory calibrations. The validation is based on advanced fuzzy logic analysis of the measurement data from the sensors.
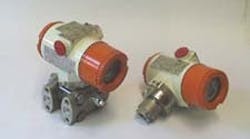
ABBs 2600T series of Foundation Fieldbus differential-pressure transmitters (Figure 3) now all feature built-in plugged-impulse-line detection diagnostics known as PILD. A board mounted in the transmitter runs the self-adaptive PILD algorithm, which is based on the spectral analysis of the differential pressure signal. It adapts to the specific process conditions at the time of installation and during normal operation compares the noise level to these conditions.
Figure 3. Foundation Fieldbus differential-pressure transmitter features built-in plugged-impulse-line detection diagnostics based on self-adaptive algorithm.
If the noise level is statistically higher than the original value, it indicates a single line plug (and can detect which of the lines); while if the noise is substantially lower then the diagnosis is of two lines plugged. The algorithm has been proved to work equally well for both liquids and gases.
At the moment we can detect if an impulse line is open or closed, but we are doing more R&D to see if we can detect the onset of a line becoming blocked before it actually becomes plugged, explains Eugenio Volonterio, R&D manager for pressure products with ABB SACE in Como, Italy.
The range of Foundation Fieldbus pressure transmitters from Yokogawa, Newnan, Ga., already boast that capability. Because they feature two sensors on the one chip one measuring differential pressure, the other static pressure the transmitters can discriminate between high and low side clogging by using an algorithm to monitor the changes in process noise over time.
So we can not only detect that plugging has occurred, we can also predict over time when plugging will start to develop, says Henk van der Bent, marketing manager for process control instrumentation, Yokogawa Europe, based in Amersfoort, the Netherlands.
Enhanced electronics
Emersons SPM advanced diagnostics has been available on Foundation Fieldbus devices (including temperature transmitters) for a few years but was extended to HART devices last December, a move Schmeling credits particularly to advances in low-power electronics. This is enabling instrument manufacturers to pack more functionality into their devices. Bridges, for example, says Krohne has been doing this for some years with our radar level devices, where different signals can indicate unusual events in the vessels, such as broken baffles or damaged mixer impellers.
Siemens Automation and Drives, Spring House, Pa., and Nuremberg, Germany, offers similar capabilities in its recently introduced Sitrans LR250 radar level transmitter. A new graphical local interface displays echo profiles and diagnostic information, allowing the user to determine dynamics in the tank at a glance. Self-diagnostic features are shown on the local display or communicated across the control network. By applying algorithms based on field data collected from real applications over the years by Siemens field service engineers, the Sonic Intelligence signal processor is said to automatically ignore obstructions to give accurate and reliable level readings.
Bridges also points to recent diagnostic developments in flowmeters. With our magnetic flowmeters, he says, were looking at changes in conductivity that could show up problems like coating on the electrodes. In the old days solids bouncing off the electrodes could create a lot of noise, but now were using that to determine what the likely solids content is in the fluid.
The companys Optiflux magmeters now feature three levels of diagnostics of the meter itself (microprocessor, memory, software, etc), of the application (problems that NAMUR recommends a meter should be able to detect, such as gas bubbles, electrode corrosion and fouling, changes in conductivity, and so on), and out-of-spec diagnostics, in which the accuracy of the meter is checked against a test signal.
The latest versions of Rosemount E-series magmeters also feature diagnostics that alert users when instrument variability is caused by process noise and not actual flow variation. This allows for adjustment to a higher coil drive frequency to stabilize the output without additional damping.
Coriolis challenges
Its probably fair to say that in the early days of Coriolis meters their reputation suffered because of a perceived inability to respond to rapidly changing process conditions such as entrained gases or the onset of two-phase flow in the pipe. While acknowledging that, Bridges notes that manufacturers in recent years have addressed these issues, putting Coriolis flow metering in greater demand than ever before.
For example, through adaptive sensor technology, Krohne claims to have succeeded in making its Optimass straight-tube Coriolis meters independent of process conditions. One of the patents we hold, says Bridges, is for a strain gauge on the sensor to compensate for expansion, but we have been using that to compensate for pressure and various other parameters. There are all kinds of things that can be derived from diagnostics.
The Holy Grail, as Bridges calls it, for Coriolis meter makers is an absolute compensation for two-phase flow.
Toward that quest, Invensys Process Systems, Foxboro, Mass., five years ago introduced its Foxboro CFT50 Coriolis transmitter. Now in widespread use, including on custody transfer duties, the CFT50 is based on patented technology developed in collaboration with Oxford University in the U.K. This involves new signal-processing techniques that are said to enable the meter to respond to changing flow conditions much faster than other Coriolis meters.
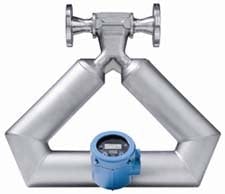
Other developments also are occurring. For instance, last year Emersons Micro Motion unit, Boulder, Colo., added an in situ meter verification capability to its flagship Elite meter (Figure 4). Specifically, it can determine whether the meter has lost any stiffness due to corrosion or scouring of the sensor tube.
Figure 4. This Coriolis meter employs a series of tones to check for tube stiffness, an indicator of erosion, corrosion and deformation.
"We discovered that by analyzing the higher level noise that is created in response to a set of very carefully designed test tones, we can actually measure the structural stiffness of the flowmeter element to see if its changed or damaged in any way. This gives us a diagnostic tool that is decoupled from changes in the process fluid. Operators dont have to take the meter out of line to test it against a flow reference. We know through our research that if the stiffness of the flow tubes has not changed [from the factory setting] there can be no erosion or corrosion or plastic deformation of the metal flow tubes which are known to be the only factors that can cause a change in the meters calibration, says Marc Buttler, product line business manager.
The test tones, which have been developed empirically, have multiple frequencies such that the fluid inside the meter U-tube has no effect on the measurement, regardless of its density or flow rate.
The meter remains in-line during the four minutes the test procedure takes to run, but does not actually record the flow during that time. This is perhaps one reason why the diagnostic tool has not yet been recognized for regulatory custody-transfer applications. Elsewhere, however, most users are experiencing great success with their own internal processes for fiscal transfer, quality management and predictive maintenance. By knowing their meter is remaining structurally sound, they can extend their own calibration intervals and go from a reactive, or even scheduled, maintenance approach to a predictive one, Buttler says.
End users clearly are clamoring for more and better diagnostics. They are starting to put pressure on manufacturers to look into this [improving diagnostics], says Krohnes Bridges. But there is always a tug of war between the two how much they are prepared to pay for it, and how much the manufacturers can afford to put into R&D. Its a technology race. Regardless, plants stand to be the winners.
