Supply chain data can vary in quality from good to downright misleading. When these data are being used as the basis for business decisions, the quality of the resulting strategic directions can vary from on-target to Im not really sure. With government regulations such as Sarbanes Oxley, Im not sure has legal implications.
Data in the supply chain are often a bewildering collection of instrument measurements, laboratory measurements, material transactions, inventories and events. These data are measured and reported separately but together provide a coordinated picture of the business transactions and material positions in the supply chain. Data validation generally requires developing coordinated sets of data. To do this the data must be physically or logically consolidated into a central repository. After collection, there are several tools, or applications, that have proven successful in validating data, including: balancing, batch tracking, measurement conciliation and data reconciliation. These applications can pinpoint errors and inconsistencies and make possible corrective actions that enhance overall quality and confidence in the raw information.
How wrong can we be?
Inaccuracies in data can be caused by problems with the raw measurement or more subtle inconsistencies in timing or interpretation. Obviously, poor meter calibration can cause a value to be in error, but an accurate value incorrectly placed in time also can cause errors. The following list of data issues provides the scope for any data quality program:
- Measurement inaccuracy has to be controlled using auditable maintenance and calibration practices;
- Missing measurements or transactions a significant cause of information quality degradation;
- Inappropriate time stamps on values these errors are often reporting problems, but also can be caused by incorrect handling of time zones or daylight savings;
- Blurry data standards does the data value have the correct units of measure, is it a compensated value, an uncompensated value, etc.?
- Poorly defined data are the data values instantaneous or are they already an average; if so what is the period of the average?
- Change management problems has the value been changed, and by whom? Has data been compensated differently in the past such that it can no longer be used as a reliable comparison with future data?
- Outdated value has the source actually updated the value or is it just displaying what it had last time?
- Improper source is the measurement being measured in the location where its expected to be measured?
- Measurement misinterpretation the measurement may be correct but with the process operating in an alternative mode it may need to be interpreted differently.
A strategy to improve consistency
Data dont get better on their own. There needs to be a strategy. This strategy requires that data be characterized and accessible. In other words you know what they are and you can get at them. The first step in improving data quality is organization. Several tools are available for making these improvements, including: characterization, creating a central repository, conversion and aggregation.
On its own, a single data point is hard to validate. But when analyzed as a component of a large data set it can be compared for consistency. However, for data values to be compared they must all be on the same basis. This means the same unit of measure, the same method of measurement, at the same reference conditions, applying to the same geographical scope and on the same timescale. Data from different sources in general will violate some if not all of these rules. The information needs to be logically characterized so that it can be appropriately processed for comparison.
To compare the monthly planned quantity of a specific type of feedstock in thousands of pounds that must be transferred to a unit, to the actual quantities of various feedstocks measured in gallons processed daily from various tanks, requires several levels of processing. Transactions at the tank level need to be aggregated to the unit, transactions at the individual feedstock level need to be aggregated to the feedstock types and daily transactions need to be summed for the month converting the units of measure. This can only be done if every data value is characterized.
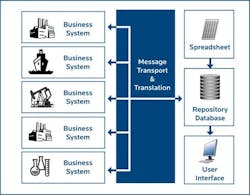
Data also must be accessible from a single point of access (Figure 1). This doesnt imply that the data must reside in the same database but just that it must be accessible in a form that allows comparison queries to be executed. For the most effective use of the analysis tools, the data need to logically or if necessary physically reside in a single coordinated data structure. This coordination should be able to bring together real-time and transactional data into a single view.
Figure 1. A repository database can provide a single point of access to information in many business systems.
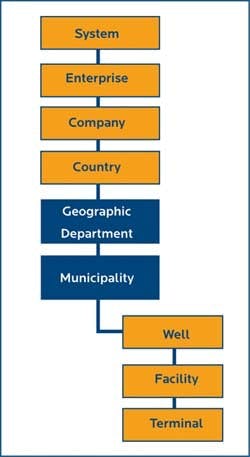
Any attempt at data consistency will involve the use of conversion and aggregation. Trying to make disparate systems use the same units of measure, same naming, same time aggregation, same geographical aggregation and the same material aggregation is a losing battle (Figure 2).
Figure 2. Collecting data at a plant and sharing it within the corporate structure can be a complicated affair.
{pb}Even if you get it right at the beginning it wont last. This is where characterization is important. Knowing the exact characteristics of the data values enables conversion and aggregation routines to be used to bring consistency to the information.
Any data quality initiative must therefore have the capability for units of measure conversion, and aggregation over different times and scopes, so that data reported at differing levels in the organization or for different materials can be combined.
Data quality toolkit
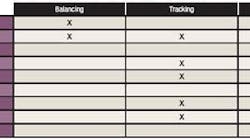
With consistent information comes the ability to apply analysis methodologies, such as balancing, measurement conciliation, batch tracking and data reconciliation (Table 1).
Table 1. Each method has its merits. (Click to enlarge.)
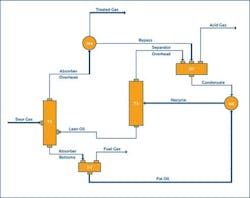
Balancing is the application of simple volume, mass or energy balances to envelopes around sections of the facility (Figure 3). The objective is to identify areas where data mismatches occur. Typically, the analysis can be exception based or can balance by commodity or owner. Balancing will show errors across a plant area, but wont show the exact location of the erroneous measurement. Further investigation and drilldown is usually necessary to pinpoint the problem.
Figure 3. A typical material and energy balance begins with a process flow diagram.
Conciliation is a process of mediating between two measurements of the same quantity based on predefined accuracies. The rules for this mediation can be as defined by a standards organization or by business rules and agreements. Rules can be as simple as, if meter A is different from meter B, use meter Bs value. Alternatively, more complex adjustments can be made using a statistical comparison of the meter accuracies. The adjustments made on each side of the conciliation process can be tracked and analyzed to provide statistical information on the relative meter performance.
In one example, a reactor thermocouple measured against another thermocouple and a calculation of the adiabatic flame temperature. Any deviation was a sign of either mechanical failure of one of the thermocouples or poor installation. Mechanical failure meant an increase in resistance with a corresponding creeping rise in reported temperature.
Batch tracking involves following batches of material along the supply chain from inventory locations through transportation systems to distribution. At each location compositions, physical qualities and quantities are calculated for comparison to previously measured qualities and quantities. This process can be applied to any supply chain configuration: continuous flow or with discrete transactions, with or without predefined batches. It requires no additional data input other than that normally captured to run the business; measurements, lab analyses, inventories and movements.
Benefits are significant. It provides predictions of qualities and quantities at any time and for any location in the supply chain. This enables continuous validation of material balances and laboratory analyses. As with any method, there are caveats: There must be an agreement between the methods and accuracy of measurements used in comparison.
Data reconciliation is the application of statistical or heuristic methods to generate a complete and consistent mass balances across an entire process flow sheet. Every measurement of inventory and flow is adjusted, subject to applied constraints, to produce a completely balanced result. The adjustments to each specific measurement that had to be made to get a balance are compared to their accuracy tolerance. This relative measure shows which values were statistically in error and need to be examined. This is a powerful analysis tool because it pinpoints specific measurements in error, it provides estimates for unknown flows and it provides accuracy statistics on measurements and balances.
Although data reconciliation is a powerful tool it isnt often fully employed. This is because the data collection and clean up required to make it effective arent easily put in place. It isnt a tool that can be implemented in isolation; it needs a data quality strategy behind it.
Is it worth gambling?
Would you bet your business on your data? Whether you like it or not youre doing that every day. Application of a coordinated data integration strategy with some data analysis tools will put you on a continuous improvement path to high inherent raw data quality. Validated, audited, consistent information with a single version of the truth is the key foundation of successful business decisions.
Andrew Nelson is product manager at Matrikon in Edmonton, Alberta, Canada. E-mail him at [email protected].


