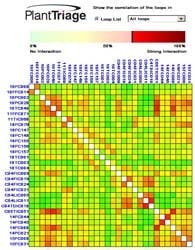
ExperTune's PlantTriage software includes a new tool that graphically highlights plant interactions. Using the new Interaction Hot Spots, engineers can quickly pinpoint the root cause of process interactions. Engineers can resolve these upsets to improve quality, energy, production rate, and process uptime, according to the company.
The browser-based Interaction Hot Spots tool is now included with PlantTriage, control loop monitor. PlantTriage monitors all plant control loops and instruments in real-time. Interactions between control loops appear as colored blocks on the Interaction Hot Spots display. Stronger interactions are indicated by stronger colors. Following PlantTriage's intuitive color scheme, green indicates no interaction, yellow indicates some interaction, and red indicates strong interaction. On a single Web page, users can see all of the significant interactions in the entire plant.
Users can click on a graphical hot spot to start a detailed investigation. This launches a context-sensitive drill-down into the relevant data from the interacting loops. This includes display of real-time process variable trends and a process interaction map. Using this information, users can establish the root cause of interaction problems in a matter of minutes.
