Determining how to optimally apply limited resources to maximize impact on the bottom line poses a key challenge to manufacturers in the process industries. Often, the best choice is to focus resources on areas that will generate the highest returns or that cause the largest losses. However, prioritizing is difficult if the value of improvements isn't well understood or is hard to measure. Relating performance to business value isn't a trivial task.
Many companies use Key Performance Indicators (KPIs) to focus attention on areas of their operations believed to have the greatest controllable impact on business profitability. To provide this clarity and action, an organization should:
1. understand which metrics significantly affect the performance of its facilities;
2. determine the limit that defines acceptable performance for each metric, and calculate each metric in a consistent and actionable manner;
3. visualize a measurable link between performance and economic benefit/cost; and
4. focus resources on identified areas of opportunity to close the gap(s).
These items are easy to say but not so easy to accomplish. If you can't yet clearly link KPIs and value, you should think about steps you can take to institutionalize a culture and process that supports the four items above, and encourage your organization to identify gaps and act on them in a deliberate fashion.
Process automation assets should figure prominently in value-improvement efforts. How visible is their performance now? Is your company focusing its resources on the appropriate areas to maximize the return from those investments?
COMPANY INITIATIVE
A few years ago NOVA Chemicals decided to look into whether gaps in performance had gone unseen and unheard, or perhaps had been seen and heard but not acted upon because of lack of support.
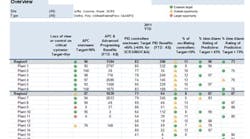
Using a combination of participation in the ARC Benchmarking Consortium and internal benchmarking, the company undertook an effort to compare process automation performance at its larger facilities. The goal was to understand if the automation assets at those facilities were comparable to peers, and to provide corroborating evidence of asset performance. This established a framework to move forward to gain the traction necessary to focus resources on areas NOVA Chemicals believes are important to improve automation asset performance. The KPIs help adjust focus to close identified gaps and deliver enhanced results and, therefore, better profitability. Figure 1 shows a summary page for a KPI report.
Initially, the automation leadership team collated all the individual automation metrics the company was tracking and distilled them into a list of potential NOVA-wide metrics. Selections satisfied some basic tenets, namely, each KPI:
• could be acted upon to improve the metric;
• reflected the health and performance of automation systems;
• required data that were relatively easy to collect from systems in most of the facilities; and
• indicated the performance of deployed resources (employee as well as equipment).
These metrics were aimed at providing a high level view that would prompt investigation and action.
This was the first step — getting clarity on the metrics and answering the question "Are we getting the value out of the systems and ensuring reliability given the resources expended?"
The team then agreed on what defined acceptable performance. This was based on a combination of industry norms, available standards and past experience. The significant challenge was defining reasonable and achievable limits — targets that all the facilities could strive to achieve. For instance, if the number of oscillating loops at most facilities exceeded 15%, and it takes extraordinary effort to reduce the KPI by 1%, setting 5% as the limit wouldn't make sense.
We fully established the initiative at our Canadian sites — in Joffre, Alta., Corunna, Ont., Moore, Ont. and St. Clair, Ont. — in January 2010.
We use Matrikon's Control Performance Monitor to track control-loop service factor and oscillation. This tool already was deployed at a number of the facilities; the performance data could be extracted from the databases in a consistent manner, while providing a link back to the originating assets. This connection to physical assets was critical — to allow us to focus resources on the particular asset(s) causing poor performance.
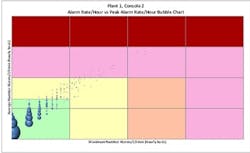
For alarm management performance, we use Matrikon's Alarm Manager to provide the backbone for the KPI. Connectivity back to assets significantly impairing the performance comes from a suite of analysis tools. A member of our automation staff, Sean Ward, augmented these to enable visualizing the minute-to-minute performance of each tag's alarm actuation rates (Figure 2).
This additional programming helps practitioners pinpoint attention on those assets that frequently cause the highest audible alarm rates for operators. By applying knowledge on top of the standard product, we can determine which tags most significantly impact performance during a specified time slice, e.g., quarterly.
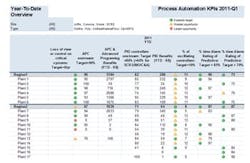
Connecting metrics back to a defensible economic basis is a widespread challenge. However, you must do this to know that you are acting in the areas that provide the best benefit for your effort. For KPIs for advanced process control (APC) and proportional-integral-derivative (PID) loops, we report the performance and economic data. This links the benefit attributed to the performance metric, as well as the opportunity missed when the asset isn't meeting the acceptable limit — providing clarity on the business impact of performance (Figure 3).
With this value visualized and contrasted to similar assets within NOVA Chemicals, we can decide where that performance issue fits in our priorities. With some additional effort, we can determine what's necessary to close the gap. Maybe we'd need to expend additional resources or refocus energy to get the desired performance.
VISUALIZATION IS VITAL
Calculating the metrics is only a portion of the effort. Metrics without a visualization interface don't have much impact — but a visualization interface with questionable data isn't very useful.
A significant challenge is determining how to visualize the KPIs in a meaningful way to stakeholders. The visualization must make sense to them personally, based on their work scope, and provide the tools to drill into the data with relative ease.
The use of tools such as pivot tables provides flexibility to view data from multiple perspectives with a few clicks of a mouse. We rely on pivot tables to summarize data and enable exposure of different levels of detail. Microsoft Excel, being so pervasive, is an ideal choice for visualizing the report data.
For NOVA Chemicals, this remains a work in progress. As advanced as today's computing technology is, providing the ability to view data in a summary format and then dynamically change the view based on user preference is still difficult — especially because the report is saved in PDF format rather than the native Excel format.
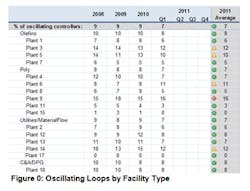
For instance, within Excel, you can view the metrics by facility name. With only a simple drag and drop action to pivot the visualization, you can compare similar facilities to determine where to focus resources grouping facilities by name, geographic region, or type of facility (Figure 4). I haven't been able to offer this functionality in the PDF format report.
Excel pivot tools enable quick generation of a simple trend for each KPI — but linking the KPIs to contextual information like production rates, business plans and market conditions is still elusive. Integrating historical information for these three specific needs would require additional complexity that may not be worth the effort.
Providing clear visibility has enabled transparent monitoring and reporting of automation performance at NOVA Chemicals. It's no longer a mystery where our automation professionals should focus their efforts. Manufacturing leadership can compare their automation performance to others without asking someone for the information. The cultural impact has been powerful. The visibility fosters focusing on the areas of automation with the most impact. The reporting also supports sustainment and continuous improvement philosophies.
There's still work to be done to get to where we imagine we can go. Computing power and software capability must catch up to our imagination. Even then, of course, we must assess what's worthwhile by balancing the additional benefit against the extra effort.
The final piece that must fall into place is a world-class group of automation professionals who use their knowledge and experience to act on the KPIs to improve the process automation. Without that, this would be a fruitless exercise. NOVA Chemicals has such an organization.
DOUG LUTZ is a Red Deer, Alta.-based process control engineer and member of the Automation Leadership Team at NOVA Chemicals. E-mail him at [email protected].
Acknowledgement
Sean Ward, NOVA Chemicals, provided the image and advanced programming related to alarm actuation rates.


