The roadmap
In practice, three parameters are used to provide a first-order-plus-dead-time model of the process dynamics and to capture the essence of the process response. The most important of these is loop dead time, which is the time delay between a change in a manipulated or disturbance variable (process input) and the resultant shift in a controlled variable (process output). If the dead time were zero and the measurement and valve resolution were unlimited, tuning would not be an issue and perfect control would be possible. But dead time always exists and encompasses the inherent delays from plug flow (transportation delays), valves (dead band and stick-slip) and digital devices (scan and execution time intervals) and the secondary lags from mixing, heat transfer, actuator, sensors and volumes in series [1].The next most important parameter is process gain, which is the final change in a process output for a given shift in a process input. A high process gain (sensitivity) is desirable because it improves the inference of a process condition from a measurement. A highly sensitive column, evaporator or reactor temperature measurement is important to recognize and control changes in composition. However, a high process gain amplifies the stick-slip in valves and the noise from non-ideal mixing. The third parameter is the process time constant, which is the time to reach 63% of the final change in a controlled variable after the process has started to move (after the dead time). In plants, this time constant rarely is constant. For a large back-mixed volume, it essentially is the residence time if the secondary lags take a back seat [2].Controller tuning settings can be computed from this first-order-plus-dead-time model. The shifts in these parameters reveal changes in the operation, process, equipment, valves and sensors. The size, direction and characteristics of these movements can provide a roadmap, knowledge of the terrain, and a full throttle controller to reach the destination of maximum process efficiency and minimum downtime.Today;s speed bump
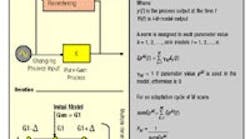
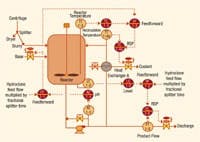
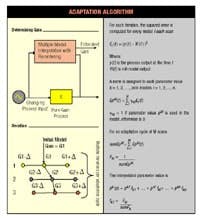
Nearly all adaptive controllers presently used at chemical plants take a relatively long time to observe changes in the process variable before adjusting tuning settings. The tuning rules are embedded and usually unknown to the user. Today;s most common adaptive controller relies on pattern recognition and will, if necessary, increase the controller gain to induce oscillations so it can get a better handle on the maneuverability of the process. The size of the transients or oscillations and the time required for identification can translate into significant process variability and lead to an adaptation rate slower than the rate of change of the process parameters. For example, it may take four or more oscillations each with a period of four hours (thus two shifts) for these adaptive controllers to search and find the best tuning settings for the temperature controller on a distillation column. Most adaptive controllers are playing catch-up even if they have seen the same situation a thousand times before. At best, these controllers provide a snapshot of the current tuning requirements and no real insight as to where the process has been or where it is going. Also, sudden unexplained shifts in the tuning settings or bursts of oscillations reduce the operator;s confidence and thus lower prospects the controllers will run in the adaptive mode and be used in future applications.In contrast, the next generation of adaptive controllers will identify a process model quickly and automatically and provide process model parameters that can be displayed, trended and diagnosed. The availability of a suite of tuning methods will enable selection of the method that best matches the process and the plant objectives. Furthermore, these controllers will remember the results for similar conditions, eliminate repetitious identification and take the initiative. Such a controller, which now has been demonstrated in plant tests, can identify the dead time, process gain and time constant for both manipulated and disturbance variables and save these as a function of a key variable. The user can apply the recommended tuning method or choose an alternative to compute the tuning settings for the current and memorized conditions. When the key variable indicates the process has changed, the tuning then is scheduled based on the process model saved in the operating region. The controller remembers the results from previous excursions and does not wait to recognize old territory. For example, for loops with nonlinear installed valve characteristics and nonlinear controlled variables such as pH, the model and tuning is scheduled based on the controller output and input, respectively.Totalized feed determines model and tuning schedules for changes in the fouling of column trays, heat transfer surfaces and sensors and in catalyst activity. The controller takes preemptive action based on operating region and in so doing refines its knowledge of the process model. Changes in these models can flag shifts in system flow resistances and compositions.Better navigationThe controller computes the integrated squared error (ISE) between the model and the process output for changes in each of three model parameters from the last best value. Exploring all combinations of three values (low, middle and high) for the three parameters requires a total of 27 models. The correction in each model parameter is interpolated by the application of weighting factors that are based on the ISE for each model normalized to a total ISE for all the models over the period of interest. After the best values are computed for each parameter, they are assigned as the middle values for the next iteration [3]. This model switching with interpolation and recentering has been proved mathematically to provide an optimum approach to the correct model [4]. The search is done sequentially first for the process gain, then the dead time and finally the time constant which reduces the number of models to nine that must be evaluated at any given time [3]. The sidebar shows the graphical concept to find the best process gain and the equations of parameter evaluation and interpolation in the adaptation algorithm.Implementation of the adaptive control, via the control system;s graphical configuration studio, simply involves selecting a disturbance variable for feedforward action and choosing the state variables and number of regions for scheduling the feedback and feedforward models. The identification time interval and model parameters and limits are initialized based on the existing tuning settings. The controller starts in the observe mode, where it will continuously and automatically identify the process model when it sees changes in the controller;s setpoint, output or feedforward action. The controller also can be switched to the learn mode, where it will update the feedback and feedforward process models in each region with an excursion. In addition, a schedule mode allows the controller to use the models in each region to change its settings. The highest level is the adapt mode, where the adaptive controller immediately uses any identified improvements. The test driveThe adaptive controller was tested on the reactor shown in Figure 1, where the ratio of base to acid reactants determines the degree of polymerization of the product. As a sensitive measure of this ratio, pH is used to manipulate the valve for the base reactant. The acid feed is the thickened slurry discharge of a centrifuge after it passes through a diverter that splits the flow between the reactor and a dryer on a time basis. The feed to the centrifuge is the bottoms flow from a hydroclone. Manipulation of the outlet temperature from a heat exchanger in the recirculation line controls the vessel temperature. There actually are two heat exchangers in parallel, with individual temperature controllers reset by the reactor temperature controller. Adjustment of a discharge flow controller setpoint controls the level. The mass flow feed to the hydroclone multiplied by the proper fraction of splitter time was added as a feedforward signal to the pH and level controller outputs and the base valve position was added as a feedforward signal to the temperature controller output.Process Gain
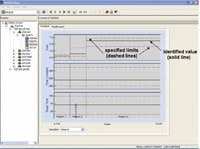
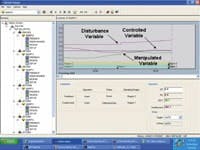
The pH process gain was a nonlinear function of the pH operating point. The setpoint was on a relatively flat portion of the titration curve but disturbances could cause excursions into a much steeper upper portion near the neutral point. After selecting pH as the state variable for scheduling the feedback and feedforward process models, the adaptive pH controller identified three regions, as shown in Figure 2, that reflect the changes in slope of the titration curve in the operating range. The feedback models were determined from setpoint changes. The feedforward process models were identified, as shown in Figure 3, whenever there was a sufficient change in the disturbance variable caused by a shift in the fraction of the splitter cycle time to the reactor.Feedforward Model
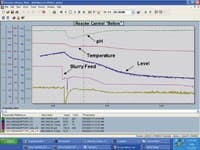
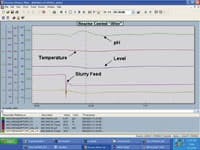
Because the feedforward signal for the temperature controller is a valve position, the feedforward model gain was scheduled based on pH controller output. The adaptive controller, through identifying changes made during the normal course of operation, improved the tuning of the level, pH and temperature loops. The controller responses before and after adaptive control was implemented are shown in Figures 4 and 5, respectively. Previous Response
Just as important as the improvement in the tuning settings was the diagnosis of problems allowed by the process models. A dramatic reduction in the process gain of the secondary temperature loop for exchanger A was linked to an increase in the system resistance. It was found that the coolant block valves had been partially closed because poor temperature control in the winter caused exchanger frosting. The essentially zero gain of the secondary temperature loop for exchanger B (not shown in Figure 1) corresponded to a broken linkage in a butterfly valve. An increase in the pH oscillations from the cycle time of the splitter was attributed to cleaner electrodes due to an increase in the recirculation flow rate. The flow control valve also had an insufficient pressure drop available to provide more than half the scale of the discharge flow controller. Dips in the flow measurement followed by a burst of flow after the valve opening increased were surmised to be caused by the intermittent plugging and sloughing of cake in the valve and to indicate an increase in slurry concentration. Finally, changes in the hydroclone efficiency appeared to be based on shifts in the feedforward-model process gain for the pH controller.Improved Performance
Figure 5. Response to a feed upset has dramatically improved thanks to the adaptive controller.Back to the futureThis new generation of adaptive controller allows all PID (proportional-integral-derivative) loops to run in the adaptive mode, with process model parameters saved in a data historian and analyzed for shifts in the plant, sensors and valves. The information on changes in the process model may be directly used to monitor loop performance and to provide more intelligent diagnostics. The models can supply the dynamics for simulations and identify candidates for feedforward control and advanced control techniques. For example, loops dominated by dead time or exhibiting disturbance models for multiple variables are candidates for model predictive control [5]. Feedforward models of compositions could be used for dynamic online property estimators and loops dominated by a single large time constant could benefit from Fuzzy Logic Control [6]. The dynamic process models can serve to create or adapt real-time simulations for prototyping new control strategies, exploring what if scenarios and training operators [5]. Process gains that decrease or time constants that increase with feed totals (e.g., reflecting the need for cleaning or catalyst deactivation) are ripe for real-time optimization of the run time.
Gregory K. McMillan is an adjunct professor at Washington University, St. Louis, and retired senior fellow of Solutia Inc. Mark S. Sowell is a fellow at Solutia Inc., St. Louis. Peter W. Wojsznis is a principal engineer at Emerson Process Management, Austin, Texas.
