Run your pump at best efficiency and improve process performance
In that elusive perfect process world, a pump always operates at its best efficiency point (BEP) ," the flow rate at the point of highest efficiency. In the real world, that's almost never the case. In fact, the average pump efficiency in industrial applications is estimated to be below 40 percent.1 Process variables, pump over-sizing and other factors can cause a pump to perform at a less-than-optimum level. A key factor in improving mean time between failure (MRBF) is determining where your pump actually is operating.
Many pump problems actually are pump and system interaction problems. This is especially true for pumps with chronic failures. When pumps operate away from their BEP ," and most industrial pump installations do ," several problems can result. (See the table.) Maintenance, repair and operation costs can go through the roof. Pump operation away from the BEP also can waste energy ," a major concern, considering that pump systems currently account for 20 percent to 50 percent of the energy used in industrial facilities.2
Another common problem you can diagnose easily by determining the actual operating condition of the pump is low net positive suction head available (NPSHA). Low NPSHA can be a major problem for centrifugal pumps. Too often the operating point and NPSHA are calculated prior to facility construction. Pumps are purchased based on the design calculations and usually are not checked again. The factory might test the pumps upon purchase to verify performance and net positive suction head required (NPSHR), but almost never checks the system.
Anyone who has been involved in facility design and fabrication knows paper design and physical reality often differ greatly. Consider the stacks of engineering change orders generated by most projects. An accurate determination of your pump's operating point can be essential to improving the MTBF, reducing maintenance costs and increasing equipment availability.
What to measure ," and where
You can determine a pump's operating point with reasonable accuracy by measuring suction pressure, discharge pressure, fluid temperature, flow rate, amperage, voltage and shaft speed.
Pressure is one of the most commonly measured process variables. Most plants have hundreds of pressure gauges. Unfortunately, many of these have broken lenses and wiggling needles. These gauges often do not give an accurate representation of system pressure. Therefore, every maintenance department should purchase a set of quality gauges for use only in the troubleshooting and performance verification process.
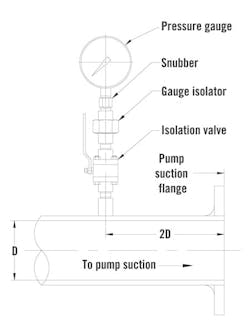
Fig. 1 illustrates the system that can be used to mount the test gauges. These gauges should be kept in calibration, clearly marked as test gauges only, and stored in a clean restricted-access area such as a locked maintenance cabinet.
Figure 1. Test Gauge Setup
Every facility should have high-quality gauges dedicated solely to trouble-shooting and performance verification.
The pressure snubber protects the gauge from process pressure spikes. If you buy a high-quality gauge, then spend an extra $15 to protect it from spikes. A gauge isolator also is recommended. It can prevent gauge or process contamination. It also allows the use of less noble metallurgy for the gauge, which might represent a significant cost savings if your process requires exotic metallurgy. The valve is essential for the isolation of the test gauges and must meet all process fire and safety requirements.
You may take pressure measurements at any location close to the pump. Many process pumps have tapped pressure connections at the suction and discharge flanges. For performance verification purposes, these will suffice.
If you have to install taps for the pressure gauges, the Hydraulic Institute standards require the suction and discharge pressure tap locations to be two diameters of straight pipe from the pump suction and discharge. Locate the taps as close as possible to locations specified in the Hydraulic Institute Standards to get the most accurate results.
Temperature is probably the most commonly measured process variable. A temperature reading of 5 Degrees F generally will be accurate enough. The exception is when the process fluid nears its boiling point ," greater accuracy is needed in this case. You might require a calibrated thermocouple or resistance temperature detector (RTD) to obtain the necessary accuracy. If the temperature probe is located in a thermal well, be sure to allow sufficient time for the process temperature to stabilize before taking a measurement.
Take the temperature measurements as close as possible to the suction flange of the pump. This location allows an accurate determination of the fluid's vapor pressure, enabling accurate NPSHA prediction.
Flow often can be the most difficult variable to measure. The high cost of transducers discourages flowmeter use in most installations. If no flowmeter is provided in the system, a portable ultrasonic flowmeter is a good option. You generally can rent these units from a local representative for $150 to $200 per day.
Most insertion-type flowmeters used as transducers for process measurement are not terribly accurate. However, they can provide valuable data. A magnetic, turbine or vortex flowmeter in the system provides a very accurate method for determining the actual flow rate.
Take the flow measurements in a location that represents the total flow from the pump. Flowmeter requirements should dictate its placement. Make sure the required number of straight pipe diameters are provided before and after the flowmeter, and follow all of the other manufacturer's recommendations to properly locate and mount your flowmeter.
You can measure amperage with any common clamp-on ammeter ," most maintenance departments have one, and most electric motor data can be correlated using amperage. Take the measurements as close as possible to the motor junction box. Hazardous environments and other safety considerations can restrict motor current checks at the motor junction box. It is often a good idea to check all three motor leads to make sure load is balanced across them.
Measure shaft speed to determine the pump shaft revolutions per minute (rpm), which can have a great effect on the pump's head. Most tachometers, even inexpensive ones, are accurate 1 rpm ," plenty accurate for most pump field tests. You can check speed using contact or non-contact tachometers. Take care to follow all required safety guidelines when working with an exposed shaft on rotating equipment.
Voltage accuracy generally is not very important unless the voltage is found to be significantly different (generally 10 percent) from the motor nameplate voltage. Any moderately accurate multimeter will suffice. If the voltage is outside the 10 percent, contact the motor manufacturer. Take voltage measurements as close as possible to the motor junction box, like amperage measurements.
Safety is the first consideration in testing, so follow all U.S. Occupational Safety and Health Administration (OSHA) and corporate guidelines or safety procedures during the test. Collect the data after the pump and the process temperatures stabilize. If the process has multiple operating conditions such as on-shift and off-shift in a one-shift facility, check each condition point. It might be possible that the pump runs right at the BEP during a nine-hour day shift, but drops below the minimum flow rate when the facility goes off-shift at night.
Still more data
Motor performance data also are important. Most electric motor manufacturers provide data for common models on their Web sites. Data for specialized motors often require a call to the local sales office or an applications-assistance line. These data generally are provided in tabular form. I find it convenient to plot these data in a spreadsheet.
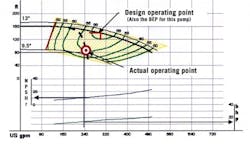
If you do not have a pump performance curve (See Fig. 2), you'll need to contact the manufacturer. Make sure the curve displays your pump's impeller trim diameter and represents the speed at which you are operating the pump.
Figure 2. Pump Performance Curve
A pump perfomance curve should include the impeller's trim diameter and the pump's operating speed.
To improve the odds of getting the correct performance curve, record as much data as possible from the pump data plate. Make sure you get the model and serial number and the impeller diameter. Many pumps are shipped from the manufacturer with a full-trim impeller and then trimmed to the required diameter by a distributor.
You also will need to know the speed at which your pump is operating. This is simple if you have a fixed-speed unit, but becomes more cumbersome if the pump uses some form of speed control such as a variable- frequency drive (VFD). If speed control is in place, use tachometer readings to provide the manufacturer with a range of operation.
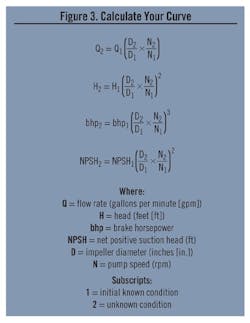
If a curve is not available for the correct operating speed or if you cannot obtain a curve for your trim diameter, you can use affinity laws to approximate pump performance. Using data from an existing performance curve at a different speed or diameter, you can calculate the data for the curve you need. The formulas are shown in Fig. 3. They can be used to change diameter, speed or both. The results of these calculations are approximations of the actual values. The affinity laws assume that efficiency is constant for small changes in speed or diameter.
A free downloadable Microsoft Excel spreadsheet that does the conversions for you can be accessed at www.mechtronixeng.com. Many existing software programs also will handle the affinity law calculations. Many manufacturers provide data in an electronic format, either in a proprietary program or commercially available software. One example is Pump-Flo from Engineered Software (www.pump-flo.com).
These programs often allow the user to adjust the performance curve for changes in impeller diameter, speed, viscosity, specific gravity, etc. The user then can plot a custom performance curve for the application.
The fluid supplier probably has the best data for your fluid. You also will need to get the fluid's vapor pressure, viscosity and specific gravity at the process temperature.
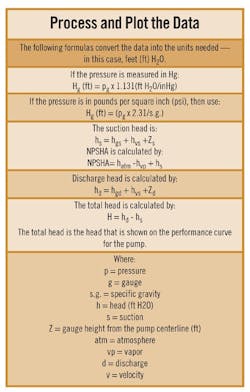
After you collect the data, you need to process them and plot them on the performance curve.
Efficiency revealed
My company was asked to help resolve a pumping problem at a chemical facility. The pump has a 3-in. suction x 2-in. discharge x 13-in. impeller. It has a horizontal end suction design and is powered by a 25-horsepower (hp) motor (4 pole, 60 Hz/1,800 rpm). It pumps a 68 Degrees F saturated formic acid solution.
The pump is sized (the design operating point) to provide 300 gallons per minute (gpm) at 140 ft H2O. The plant is at sea level, and the local atmospheric pressure is 33.94 ft H2O (29.92 in. mercury [Hg]).
The pump is not providing the required flow and pressure. Maintenance installs an ultrasonic flowmeter, pressure gauges, an ammeter, a tachometer and a voltmeter. Personnel record the following data:
Flow rate = 240 gpm
Suction pressure = 23.5 in. of mercury or 26.58 ft
Discharge pressure = 26 pounds per square inch gauge (psig)
Tachometer = 1,787 rpm
Ammeter = 17.5 A
Voltage = 230 volts AC (VAC)
Based on the flow rate and the suction and discharge pipe sizes, the velocity heads are found to be:
hvs = 1.69 ft and hvd = 8.18 ft
From references, the fluid's properties at the pumping temperature are:
pvp = 0.65 psia at the pumping temperature
s.g. = 1.221
viscosity = 1.45 centipoise (cp) (viscosity change is
negligible ," no correction needed)
First, calculate the NPSHA:
hgs = [23.5 in. Hg x 1.131(ft H2O/in. Hg)] = 26.58 ft
hs = -26.58 + 1.69 + 0.5 = -24.39 ft
hvp = (0.65 x 2.31)/1.221 = 1.23 ft
hatm = 33.94 ft
Therefore:
NPSHA = 33.94 - 1.23 -24.39 = 8.32 ft
Then we calculate the discharge head:
hgd = (26 x 2.31)/1.221 = 49.19 ft
Therefore:
hd = 49.19 + 8.18 + 1 = 58.37 ft
Total Head:
H = 58.37 - (-24.39) = 82.76 ft
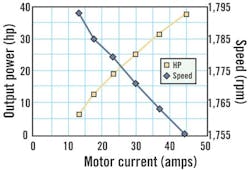
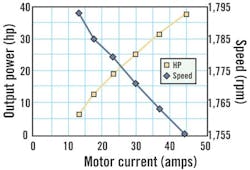
From the motor performance curve (Fig. 4) and the amperage data, you can see that the pump is operating at less power than predicted by the pump performance curve (Fig. 2).
Figure 4. Motor Performance Curve
The motor curve shows that the pump actually is operating at less power than the pump performance curve (Fig.2) predicts.
A performance curve reading at 17.5 amps corresponds to approximately 11.5 hp vs. a performance curve expectation of approximately 14 brake horsepower (BHP). Plotting the flow rate and total head on the performance curve shows the pump is operating well off the stated performance curve. The NPSHA of 8.32 ft is well below the 10.7 ft required by the pump at 240 gpm. This performance reduction likely is the result of cavitation.
Many users do not believe their pumps are cavitating because they cannot hear the characteristic "gravel" sound in the pump. After the performance breaks down, the pump might go into full-sheet cavitation. In this extreme form of cavitation, the entire vane becomes enveloped with vapor bubbles displacing a large volume of liquid. When this severe form of cavitation happens, the noise often drops off because the bubbles do not collapse until they are far downstream. Many users have no idea the pump is cavitating.
The reduction in horsepower also is a clue that the pump is pumping two-phase flow (vapor bubbles and liquid). The fluid density reduction causes a reduction in horsepower demand.
If the pump in this example had been operating satisfactorily and then stopped working, the user should have asked: "What changed?" Are suction strainers present in the system? Could they be clogged?
In one case, an investigation revealed a debris-filled suction strainer on a cooling tower pump's inlet. Neither operations nor maintenance knew the strainer existed until a system performance evaluation showed the pump was cavitating severely. The cooling tower had been cleaned three times to improve performance before we found the strainer.
If you have a similar pump problem, ask a few key questions. Did your facility recently clean a tank or another vessel, depositing slag or scale into the pump or strainer? Has the process changed? Is the liquid hotter? Did the filter size or liquid level change?
Conclusion
As a rule of thumb, pumps operate best when the flow rate is between 80 percent to 120 percent of the BEP flow rate. Chronic pump or seal failures often are a sign of operation problems.
By evaluating the actual operating point of your pumps and correcting operating point problems, you can drastically improve availability and slash maintenance and repair costs. Relatively inexpensive methods often can be used to correct operation problems and improve pump performance. I will introduce some of these methods in a follow-up article slated for Chemical Processing's September issue.
Case is president of MechTronix Engineering, Elk Grove, Calif. The company specializes in rotating equipment design, testing, condition monitoring, analysis and education. Contact him at [email protected].
