Visualization Tool Shows Off Bayer's Results
Chemical companies have been slower to adopt CFD than discrete manufacturers, which have used the technique for decades. Nevertheless, a growing number of chemical processing companies are reaping the benefits of CFD to identify areas where existing products, processes or procedures can be improved, and to simulate the impact that changes in key variables will have on the overall production process.
"CFD promises to allow users to make things faster, increase safety and reduce costs," says Shane Wagner, international sales manager for Intelligent Light, Lyndhurst, N.J.
Instead of building 10 prototypes to determine which is the best, Wagner explains, users can apply CFD to simulate processes and run through "what if" scenarios. CFD also allows users to peek at microscopic-level details or demonstrate situations that would be too dangerous to run live.
Companies typically run solvers to perform complex CFD calculations and then use a visualization and post-processing tool such as Intelligent Light's FieldView to put a graphical face on those figures. One FieldView user is Bayer AG, the global manufacturer whose products range from pharmaceuticals to herbicides and fungicides to a variety of basic chemicals.
"It is important that you present the results of your sophisticated simulation visually and spare more mathematical, technical details," says Christian von Torne, Ph.D., manager of Bayer's CFD team, part of the Competence Center Computational Solutions of Bayer Technology Services in Leverkusen, Germany. "In some cases, this is the only way to communicate details hidden in the data."
Bayer's CFD team uses still images, as well as animation, in its presentations to internal and external customers of its simulation and consulting services. FieldView's visualization capabilities enable presenters to hone-in on important aspects of the simulation and depict actions or cause-and-effect relationships that would be difficult, if not impossible, to see in a real experiment.
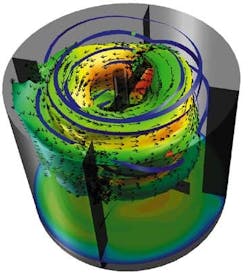
In one instance, the team used key-frame animation to show a mixing tank (photo) stirring and to highlight features using evolving streamlines or isosurfaces of concentration or volume fraction.
"The (solver) software we use produces literally millions of data sets from which we have to extract information that our customers need. This is not an easy task, and its value should not be underestimated," stresses von Torne. "If our post-processing does not meet the superior quality of our simulation, the results offered by the post-processor will not be optimal. In fact, bad post-processing may ruin your whole simulation."
A stirred tank shown with streamlines and isosurface shown concentrations, as well as the vector field of the flow. These data were used to optimize a polymerization reaction.
See the possibilities
First, von Torne explains, the tool is intuitive and straightforward to use. "In spite of its powerful features, you do not need to look into the manual very often," he says. "You can just install the software and start to work with it. It is fast, robust and it fits into our standard workflow very smoothly."
Another consideration was that Bayer has some in-house code that has no visualization capabilities. The company did not want to develop its own visualization software, so, after evaluating various options, Bayer determined that FieldView provided high-level visualization capabilities and a feature-rich set of post-processing methods without requiring too much additional work from the end-user.
"Within days," says von Torne, "we had a complete visualization for our in-house tools, which was unthinkable with proprietary visualization tool CFD code."
Finally, because Bayer uses a number of CFD tools, von Torne says it is best to have a single visualization tool to compare results obtained with different CFD codes. "FieldView can read all data formats used [by] our CFD group, so it enables us to draw more conclusions than we would get from using different visualization tools," he says.
Bayer improved the efficiency of custom twin-screw development by using in-house code for simulation, then using FieldView. Red areas denote regions of high shear stress, blue with low shear stress.
Applications at work
Visualization also has been instrumental in equipment efficiency optimization. When Bayer wanted to find recirculation zones in its reactors, it had trouble visualizing several aspects of a single reactor because data came from different simulation tools.
On one hand, Bayer had the fine resolution of its CFD simulation; on the other hand, it had rather coarse data from its highly detailed process simulation. FieldView features ," including the Feature Extraction-Vortex Core tool, isosurfaces and cutting planes with projected vectors ," helped identify the zones and present the results.
"Using FieldView, this was a rather painless effort that could have been a lot more complicated," von Torne maintains.
By Sue Garrison, contributing editor

