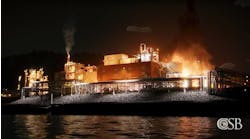
Quantitative risk analysis (QRA) is a systematic approach to assessing and quantifying risks in industrial settings, particularly in chemical and petrochemical industries. Developed in response to major industrial incidents, QRA transforms risk perception from subjective to measurable data.
Key historical incidents that prompted the development of QRA include:
- The 1976 Seveso, Italy, chemical disaster, which released a carcinogenic dioxin
- The 1984 Bhopal, India, methyl isocyanate leak, killing thousands
- The 2005 Hertfordshire Oil Terminal explosion in England
These events led to regulatory changes, such as the European Union's Seveso Directives, which mandated proactive safety measures and risk assessments. While the United States has some safety regulations like OSHA's Process Safety Management Rules, comprehensive QRA is not as strictly required as in the European Union (EU).
Let’s delve into the history and rationale behind QRA.
QRA and preventive maintenance (PM) are related because good PM reduces failure rates and extends equipment life. Preparing a QRA is often complex, but I will highlight some important elements to simplify it.
The History
“QRA is a formal and systematic approach to estimating the likelihood and consequences of hazardous events, and expressing the results quantitatively as risk to people, the environment or your business. It also assesses the robustness and validity of quantitative results, by identifying critical assumptions and risk-driving elements,” wrote Andreas Falck, senior principal engineer at DNV, in a post on the company’s website. DNV is a provider of digital solutions for managing risk and improving safety and asset performance.
Significant Chemical and Petrochemical Incidents
Current risk assessment methodologies were developed from incident histories. Major incidents included loss of containment in the reactor or storage tank; minor incidents included spills, pump failures, heat exchanger failures and instrumentation malfunctions. If a pump did not start when it was supposed to or a heat exchanger developed a leak, those were often coded and counted in the failure databases. Below is a little more insight into the incident histories I mentioned before.
On July 10, 1976, in Seveso, Italy, a runaway chemical reaction involving trichlorophenol released 2,3,7,8 Tetracholordibenzo p dioxin (TCDD). TCDD is a carcinogenic chemical that is fatal to exposed animals. The dioxin release poisoned over six hectares, killed livestock, caused chloracne in 640 individuals, and hospitalized 19 children. The chemical was so hazardous it required five years for the Italian government to remediate the site, and the contaminated soils were placed in a concrete vault with a lifetime of several thousand years.
The European Parliament issued the Seveso Directive on June 24, 1982, introducing and requiring risk assessment for the chemical and petrochemical industries. The Seveso II (1996) and Seveso III (2012) directives soon followed. The directives require proactive control measures, safety management systems, emergency preparedness plans and regulated packaging, shipping and labeling of dangerous chemicals.
In Bhopal, India, the release of methyl isocyanate from a Union Carbide subsidiary on Dec. 3, 1984, killed approximately 2,260 and injured 558,125 people(1). The Bhopal incident caused the dissolution and sale of Union Carbide Company and UCC’s chairman of the board was charged with manslaughter by the government of India.
The Seveso and Bhopal incidents, followed by the Seveso Directives and their fallout, sent a shockwave through the chemical industry worldwide. In the United States, this was the beginning of a movement to make chemical manufacturing safer.
The American Institute of Chemical Engineers (AIChE) responded to Bhopal by forming the Center for Chemical Process Safety (CCPS) in 1985. By 1990, the CCPS had published a dozen guidebooks on process safety improvements.
In the early 1980s, the U.S. chemical industry formed Chemtrek to help address the consequences of transportation-related incidents involving hazardous chemicals. Initially, Chemtrek dispatched highly trained technicians to help minimize damage from transportation-related chemical incidents.
In July of 1988, Occidental’s North Sea Oil platform, Piper Alpha, caught fire, exploded and collapsed, killing 165 of those onboard plus two rescuers. This incident further highlighted the need for improved chemical and petrochemical safety.
The U.S. government saw the need for chemical safety as well. In 1990, OSHA published a draft of 29CFR1910.119, the regulation on the Standard for Management of Highly Hazardous Chemicals. The Standard became effective in 1991. The list of chemicals covered under the PSM standard is found in Appendix A of the regulations. The regulation also covers all flammable substances (petroleum included) with a flash point less than 100oF.
The National Research Council (U.S.) published Science and Judgement in Risk Assessment (1994). The publication primarily dealt with cancer risks from air pollution and low-level exposures to air toxicants. For any medicines or chemical exposures, there is some risk to the exposed. The publication also laid the statistical approach for the effects of exposure to toxic chemicals.
The Hertfordshire oil terminal Buncefield (owned by Total), had a devastating explosion and fire that was so big that it registered 2.4 on the Richter scale. That 1995 incident injured 43 people and caused major structural damage to the nearby community. The incident was caused by overfilling of a petroleum tank creating a vapor cloud that exploded. The explosion set most of the rest of the terminal on fire.
In 1996, the U.S. Department of Energy issued the DOE Handbook of Chemical Process Analysis, which required all DOE contractors to follow.
Resources to Judge Risk, Justify Safety Expenses
The development of a good QRA requires a database for incident frequencies. Data allows us to answer the question, “How safe is my facility and community?” The safety of any facility and surrounding community depends on proactive maintenance, operator training and good management. The probability of chemical release incidents is very low(2), which often makes installing expensive preventive measures very difficult for any industry. So how do we judge risk and justify safety expenses?
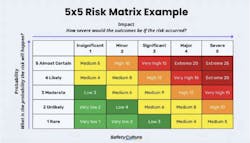
One of the initial developments in defining risk is the management matrix. The matrix is a simple color-coded chart that attempts to quantify risks. There are several versions of the risk matrix, including one that attempts to include economic damage and risk, as shown in Figure 1.
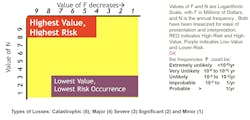
Some versions of the matrix use millions of dollars (logarithmic scale) as cost headers in the top row to quantify the severity of the incident. Cost considerations can include loss of inventory, lost sales, facility reconstruction, etc. The risk assessment matrix can be dollarized and frequency-coded. A logarithmic cost category in millions of dollars replaces the risk categories, and logarithmic estimates of annual frequencies replace the probability (see Figure 2).
These matrices largely depend upon their creator’s opinion about risks and costs. What was needed was a more solidly based approach to risk assessments.
The Economic Commission for Europe, the UK government and the Dutch government responded to the challenge of quantifying risk by issuing a Guideline for Risk Assessment, which highlighted risk from transport for shipments by rail, including statistical evaluation of a typical incident.
They also released an additional series of color-coded books:
Methods for Determination of Possible Damage to people and objects from the release of hazardous Materials (green book) — Damage effects caused by heat, explosion (on structures), (explosion on humans), products released during a fire, effects of intoxication (Inhalation), and protection from a gas cloud by remaining indoors. Each section has worked examples and a moderately good database for compounds.
Guidelines for Quantitative Risk Assessment CPR18E (purple book) — Calculation probabilities for accidents in stationary and transport-related activities, including pipelines.
Methods for Determining and Processing Probabilities (red book) — A thorough discussion of the statistical basis of risk and how to apply it, and statistical techniques including Bayesian analysis, reliability theory, data analysis, references on reliability databases from EU sources, and data compendia from EU sources.
Calculation of Physical Effects due to the release of Hazardous Materials — Liquids and Gases (yellow book) — Contains calculation methods for vapor cloud formation, spray releases, vapor cloud explosions, pool evaporation, heat flux from fires, vessel rupture, and how the models can be used to perform damage assessments — plus physical data on a number of compounds.
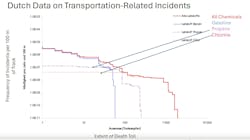
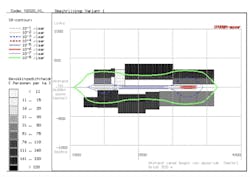
The Guideline for Risk Assessment addresses the value of an event tree approach to QRA combined with statistical analysis of railway incidents where there was a release of hazardous materials and evaluation of the potential consequences of a release. They suggested two types of information be assembled based on Dutch experiences. The first was a frequency-probit graph for chemicals in transport (Figure 3). The second was an analysis of the population densities adjacent to the railroad lines (Figure 4). From these two graphs one can develop an idea of the population at risk from hazmat rail incidents.
The scale on both axes is distance. The hatched areas represent population densities. The curves indicate the risk levels per year. Green is the lowest risk frequency.
Developing an incident database and computerized modeling tools has enabled the chemical industry to allow evidence-based assessment of the hazards associated with chemical manufacture and transportation.
There are other approaches to the QRA Process. In Part 2, we will discuss Singapore’s Approach to QRA, and in Part 3 we will present risk scenarios and data.
References
- There was a release of MIC in Allied Chemical’s Moundsville, WV plant in 1978 (approximate date). Two chemical plant workers entered the hazardous area without proper protective equipment. After they successfully shut down the leak, they were hospitalized with lung problems. The MIC causes lung tissue to release fluid. The workers essentially drowned in their own fluids because of their exposure and improper PPE usage.
- The probabilities of chemical accidents and releases is on the order of 10-6 to 10-9 incidents depending upon the time frame used to measure the occurrences.
