The best process control in terms of ability to improve operational efficiency and capacity requires an understanding of the process relationships and the effect of operating conditions set by the automation system. Thus, process engineers clearly should play an important role in process control — but usually don’t. This lack of involvement leads to lots of missed opportunities to enhance a plant’s process control system.
So, here we’ll look at some common opportunities, explaining why they are overlooked and how to take advantage of them.
Disturbance Location
This is the most fundamental missed opportunity with widespread implications. It stems from a failure to realize that most disturbances aren’t on the process output but, rather, on the many inputs to the process, which we term load disturbances. For instance, if you think about the temperature and composition control of any volume, the changes in process streams entering the volume are the disturbances. Likewise, for level and gas pressure control, the disturbances are changes in flows going into and out of the volume. The material and energy balances that determine the value of the process variables being controlled result from inputs; pointing this up, the dynamic model is the integration of the derivatives for these balances. Even control valve problems and pressure changes show up as changes in flows into or out of the process. For surge and pH control, there are momentums and charge balances but material and energy balances still are at play. All this is obvious to a process engineer. Theoreticians and practitioners without a chemical engineering background may view disturbances as being on the process output, making the response for disturbance rejection similar to what is needed for a setpoint response.
Studies in a chemical engineering department over 40 years ago determined that proportional-integral-derivative (PID) control was near optimal for load disturbances [1]. However, control theoreticians developed internal model control (IMC) and touted it as better than PID control. IMC tuning and an emphasis on closed-loop time constant for setpoint response focused on a gradual response to minimize overshoot of the controller output of the final resting value (FRV) for a new setpoint.
For self-regulating processes where the process time constant is much larger than the deadtime, the approach to setpoint is too slow and never will reach setpoint for integrating and runaway processes without FRV overshoot. A fix is to use integrating process tuning rules that emphasize load disturbance rejection with an arrest time instead of relying on the closed-loop time constant as the key parameter for getting the tuning settings. Self-regulating processes with a ratio of process time constant to deadtime greater than four then are classified as near-integrating processes and integrating process tuning rules used. A setpoint lead/lag or a PID structure that puts a 0–1 factor on the effect of setpoint changes on the proportional and derivative mode response provides the desired setpoint response.
Process Responses
Process engineers can better understand the what, why and where of different process responses. The open-loop response (response with controller in manual) indicates the type of process. The open-loop response for a self-regulating process will settle out at a new steady state for a given load disturbance. This response is seen in the derivative for the material or energy balance where there’s a term with the process variable that has the opposite sign of the term for the effect of process inputs, resulting in negative feedback in the process. For a near-integrating process, the time to steady state is too long and the response with FRV overshoot needed for load disturbance rejection is similar to that for an integrating process. Composition and temperature control of vessels and columns have a near-integrating response. The open-loop response for an integrating process is a ramp with no steady state in the operating limits. There’s no opposite sign term with the process variable in the derivative and, consequently, no negative feedback in the process. The classic example is level but gas pressure, batch composition and temperature control also have an integrating response. The open-loop response for a runaway process will accelerate toward a limit, triggering the safety instrumented system or blowing a relief device. The term with the process variable has the same sign as the one for process inputs in the derivative, causing positive feedback in the runaway process. Common examples are temperature control of highly exothermic reactors and parallel heat exchangers as well as flow pressure characteristics of steam jets and axial or centrifugal compressors to the left of the surge point. The need for more-aggressive proportional action to provide negative feedback correction increases as you go from near-integrating to integrating to runaway processes.
Many people don’t realize that too low a controller gain, not just one too high, can cause large oscillations of processes lacking negative feedback, resulting in a window of allowable controller gains. This window closes for excessive deadtime or a secondary time constant. The oscillations generally are much larger and slower for too low a PID gain, too. Most of control theory concentrates on too high a controller gain that causes an unstable process whereas the more frequent case is too low a controller gain. Another chemical engineering department reported over 40 years ago on the dire consequences for a runaway process [2]. While process design should minimize the chances of a runaway, most notably by sufficient cooling capability for exothermic reactors, the increase in heat release is so great for some polymerization reactors that providing fast-enough cooling isn’t possible. For safety reasons, a controller isn’t placed in manual long enough to see the acceleration, so the positive feedback process time constant is estimated from the derivative for the energy balance.
An appendix available online discusses how you can use material and energy balances to determine the types of process responses and identify process time constants and process gains. (See sidebar.)
These relationships can define process cause and effects that can lead to improved controller tuning and performance by the selection of better tuning rules and process variables for scheduling of tuning settings. They also affect the choice of control valve trim and the feedforward design. An online appendix describes many of these relationships and their implications.
Titration Curves
The titration curve from a laboratory often has an abscissa that simply is the volume of reagent added to the sample. You must divide that abscissa by the sample volume and correct for any difference in reagent strength. Often a lab will use a lower reagent concentration than the plant, which is a clue to why pH control is so difficult. You must convert the plant curve abscissa to the ratio of reagent flow to process flow, which — for identical volumetric flow units for reagent and process flows — then is the same ratio as the laboratory curve. The slope of the titration curve is part of the process gain term used for PID tuning and loop analysis. We’ll cover the opportunity to get this term and others to correctly describe the open-loop response in the next (terminology revelations) section.
Most computer-generated titration curves using even the most sophisticated software are way off in slope. For strong acids and bases, the theoretical curves have a slope that changes by a factor of ten for every pH unit deviation from neutrality. This theoretical calculation is attractive because it’s so easy; some articles in the literature suggest linearization by converting the controlled variable from pH to hydrogen ion concentration by a simple theoretical equation. However, in almost all plant applications, seemingly negligible concentrations of dissolved carbon dioxide from exposure to air and weak acids, bases and conjugate salts make the lab curve slope four orders of magnitude less than the theoretical curve in the neutral region. A charge balance that includes all these components by fast interval halving is the solution, as detailed in “Improve pH Control,” https://bit.ly/3m8XndR. You may need to adjust carbonic acid concentration for the model curve to match the lab curve slope in the 4–8 pH region, which often is the sector requiring the most-exact slope because the setpoint frequently is near 7 pH.
Terminology Revelation’s
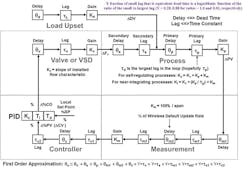
The literature and most software use the terms process gain, process deadtime and process time constant although all the other parts of the control loop affect the terms; Figure 1 shows a block diagram for a PID loop that indicates the impacts. By using more encompassing terms, we can focus on how each part of the control loop influences dynamics — the process part, in particular, often is neglected and not thoroughly analyzed. Better terms are open-loop gain, open-loop time constant and total-loop deadtime.
Figure 1. Every part of the control loop affects its dynamics.
Consider a self-regulating loop manipulating a valve or variable speed drive (VSD) with flow and process variable engineering units (eu). The open-loop gain (Ko) is the product of valve or VSD gain (Kv), process gain (Kp) and measurement gain (Km). Kv is the slope of the installed flow characteristic of the valve or VSD in flow eu per % PID output. Kp is the change in the process variable (PV) in PV eu per flow eu. For temperature and composition control, the process gain first is analyzed as the slope of a plot of temperature or composition versus the ratio of manipulated flow to feed flow as seen in a titration curve. You must multiply the slope, i.e., the change in PV eu per change in ratio, by a hidden factor that is the inverse of the feed flow; process gain then is PV eu per manipulated flow eu. The subsequent multiplication by Km, which, in most cases, is simply 100% divided by measurement span, gives a dimensionless open-loop gain (% PID PV per % PID output) for self-regulating processes. Despite what many academics may think, nearly all industrial PID algorithms work in % signals, not eu.
The open-loop time constant is the largest one in the loop. For composition and temperature control of back-mixed liquid volumes and heat transfer manipulation, the largest time constant is in the process. For flow and plug-flow volumes without heat transfer, the largest time constant is in the automation system — usually the result of a slow sensor (e.g., electrode or thermowell), high transmitter damping or signal filter setting or a slow valve response.
The total deadtime is the summation of all the deadtime sources as you traverse the loop. Except for columns, conveyor systems, reagent injection and large plug-flow liquid volumes, the source of most of the total deadtime usually is the automation system.
Hidden Factor
This factor, which is the inverse of feed flow, is obvious from the derivative for the energy balance. Process engineers can appreciate the consequences in that the open-loop gain dramatically increases at low production rates. That, combined with a larger deadtime from higher transportation delays for lower flow in plug-flow volumes, often steeper slope in the plot of temperature versus the ratio, greater valve stiction near the closed position, and more noise in flow signals cause oscillations unless addressed by process, equipment and automation system design.
For example, jacket temperature controllers should manipulate a makeup coolant flow with a recycle and pressure control of cooling water return flow to keep jacket flow constant. A precise throttling valve must regulate the coolant; this should consist of a globe valve with low-friction packing, a sensitive diaphragm actuator and a high gain sensitive positioner.
Deadtime Sources
The minimum peak error and minimum integrated error for a load disturbance is proportional to the deadtime and deadtime squared, respectively, for aggressive PID tuning (e.g., high PID gain and low reset time). The total deadtime is the summation of pure delays plus a fraction of time constants smaller than the largest time constant. As the ratio of the small time constant to largest one approaches one, the fraction approaches 0.88. For equal time constants in series, the deadtime is a fraction of the sum with the fraction approaching 0.88 as the number of time constants approach 100. The deadtime from wireless and digital devices is half the update or execution rate or scan time. The deadtime from at-line analyzers is the sample transportation delay plus half the cycle time plus analysis time.
Ratio Control
The literature touts feedforward control, typically ignoring flow ratio control, which actually is more widely useful. Provided you have good flow meters, keeping a manipulated flow in the right ratio to a feed flow is a great step forward; temperature and composition are plotted against a manipulated to feed flow ratio and the process flow diagram shows the flows for normal operation. You correct that ratio by adjusting a bias for back-mixed volumes and the actual ratio for plug-flow volumes. Many unit operations, most notably distillation columns, are started up on ratio control until the composition or temperature measurement represents desired operating conditions. The ratio uses mass flows in honor of the mass balance. For gas pressure control, flow measurements are too slow, necessitating flow feedforward using linear installed flow characteristics achieved by linear trim and a large valve-to-system pressure drop ratio or by signal characterization.
Coriolis Meters
When mass flow measurement is required, opting for pressure and temperature compensation of velocity and volumetric flow meters may not suffice. Process engineers realize that these measurements depend upon a known and constant composition. Coriolis flow meters are the only true mass flow meters independent of composition. They don’t drift to any extent or require periodic calibration; are least affected by upstream and downstream piping configuration; provide an exceptionally accurate density measurement that can be used for an inferential composition measurement for two components with significant density differences; and boast an order-of-magnitude better accuracy and rangeability than all other flow measurements when you take into account the signal-to-noise ratio and all the installation, operating condition and long-term effects. For liquid reactors, the choice is obvious to achieve the right stoichiometry but a closer look at most other applications would reveal the long-term benefits of Coriolis meters for process performance.
Variability Transfer
Process control doesn’t make variability disappear but transfers the variability from a key process variable such as temperature, composition or pressure to the manipulated flow. Some applications require tight level control — e.g., reactor residence control by manipulation of discharge flow or material balance control of distillate receivers for internal reflux control by manipulation of reflux flow. For volumes where level can vary, the transfer of variability is minimized just to keep the level within an operating range that doesn’t activate alarms. This strategy is called maximization of absorption of variability and most notably is used for surge tanks. Tight or loose level control is achieved by tuning rules that don’t violate the low gain limit for integrating processes by keeping the product of the controller gain and reset time greater than twice the inverse of the integrating process gain for level loops. The tuning rule gets more sophisticated for the less-common loops that have a large deadtime.
External-Reset
Controller gains aren’t as large as they should be, often because the operator doesn’t like sudden changes in manipulated flow. Simply turning on external-reset and using a feedback of the actual manipulated variable, as first documented by Shinskey, will prevent a PID changing faster than a manipulated variable can respond. This enables the use of setpoint rate limits on any manipulated flow.
External-reset feedback has many other benefits, including the stopping of oscillations from a slow secondary loop, slow control valve or VSD, deadband, resolution and sensitivity limits, and unnecessary crossings of split range points. It can handle fast opening and slow closing surge valves and deal with slow wireless update rate and analyzer cycle times for self-regulating processes without retuning. It also can facilitate a fast recovery for abnormal operation and a gradual optimization by valve position control [3] [4] [5].
Seize The Opportunities
Using their process knowledge, process engineers can steer automation systems away from many wrong terms suggested by the literature and can discover many missed opportunities. A digital twin that has process and automation system dynamics can provide the knowledge discovery needed. By developing online process metrics, engineers can show the benefits in case studies in the digital twin and, most importantly, the actual process. They can find the consequences of abnormal operation and mistakes as well as viable solutions. Metrics can reveal the value of improvements and consequences of missing or misguided automation. Learning from mistakes and making the most out of opportunities by a synergy of process and automation knowledge and the digital twin as the proving ground are the keys to a future of innovation [6] [7] [8].
GREGORY K. McMILLAN is part-time senior principal software engineer in simulation research and development for Emerson, Round Rock, Texas. Email him at [email protected].
REFERENCES
1. Bohl, A., and McAvoy, T., “Linear Feedback vs. Time Optimal Control II — The Regulator Problem,” Ind. Eng. Chem., Process Des. Dev., Vol. 15, No. 1 (1976).
2. Luyben, W., and Cheung, T., “Proportional-Derivative Control of Exothermic Reactors,” Proceedings, Vol. 3, Joint Automatic Control Conference, Philadelphia (Oct. 1978).
3. Shinskey, F. G., “The Power of External-Reset Feedback,” Control, www.controlglobal.com/articles/2006/095/ (May 2006).
4. McMillan, G. K., Tuning and Control Loop Performance, 4th rev. ed., Momentum Press, New York City (2014).
5. McMillan, G. K., and Nino, S., “Greatest Sources of Process Control Knowledge,” Control, www.controlglobal.com/articles/2017/the-greatest-source-of-process-control-knowledge/ (Oct. 2017).
6. McMillan, G. K., “Control Talk Blogs — Missed Opportunities in Process Control, Parts 1–6,” Control, www.controlglobal.com/blogs/controltalkblog/ (2019).
7. McMillan, G. K., and Berutti, M., “Virtual Plant Virtuosity,” Control, www.controlglobal.com/articles/2017/virtual-plant-virtuosity/ (Aug. 2017)
8. McMillan, G. K., and Hunter, P. V., Process/Industrial Instruments and Controls, 6th ed., McGraw-Hill, New York City (2019).


