Eli Lilly was faced with the challenge of finding additional capacity at one of its manufacturing facilities to accommodate a new process. Through a partnership between its process modeling and manufacturing groups, the company identified combinations of process adjustments and cycle time reductions that could provide the required capacity with no additional capital spending.
The modeling environment and toolset maintained by Lilly’s process modeling group, part of its central engineering group, enabled the rapid development of an overall process model and evaluation of over 150 unique combinations of process alternatives, ranging from cycle time improvements to addition of capital equipment.
The results were delivered within the same modeling environment the manufacturing group already uses for emissions monitoring. This effort has demonstrated the superior capability of the modeling environment compared to the spreadsheet-based systems now employed for other tasks — and has renewed interest in using it more widely for process improvement and technology transfer.
THE CHALLENGE
The facility has a number of batch unit operations that several processes can share. Lilly wanted to use the equipment for a new process. The challenge was to reduce the campaign of an existing process for manufacturing an active pharmaceutical ingredient (API) from approximately 40 weeks to 26 weeks or less, allowing the new process adequate time on the equipment. The project also had a tight schedule because the new process was to be moved into the plant within a year. If the existing process couldn’t be modified in time, it would have to be relocated to larger equipment in another building on the site or even to another plant — both options requiring considerable time and expense.
Meanwhile, the manufacturing engineering team was pursuing several process improvements, including optimizing current unit operations, telescoping two process steps into one, and raising process yield.
The project team at the manufacturing site recognized the complexity of the effort and collaborated with the process modeling group to explore whether modeling tools could assist with choosing the optimal production options.
THE MODEL
A high-level simplified process model was developed to capture the overall cycle time and yield of the relevant process steps. This model didn’t include all materials specified in the recipe. For example, water was used in place of specific process constituents; this allowed for both rapid model construction and acceptable accuracy (because the model isn’t used to carry out an overall material balance). However, the model structure would easily incorporate materials and other particulars to conduct a future detailed analysis if so desired.
Individual operations such as vessel charges, heating/cooling, material transfers and separations weren’t modeled. Instead, higher-level “unit procedures” (e.g., extraction or crystallization) were. Each unit procedure typically consists of just one or two operations, allowing modeling of the overall cycle time and yield for that procedure. This approach enabled rapid model development and, by using the integrated production planning and scheduling capabilities, quicker simulations of campaigns.
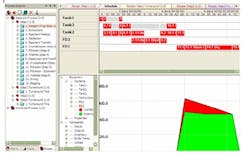
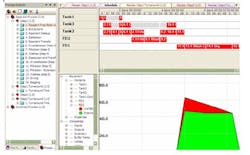
In total, over 150 scenarios were evaluated while capturing the essential information about the process. Figure 1 illustrates an example of the simplified model and production schedule.
The large number of options under consideration involved a number of scenarios, including:
• Eliminating a purification step, combining two consecutive steps into a single step, or both. These options would change cycle times for cleaning or turnaround between steps, reducing overall campaign time.
• Adding a duplicate set of equipment. Certain items, such as the filter/dryer, are significantly more expensive; so scenarios were developed and evaluated both with and without high cost items.
• Incorporating additional process improvements being made by the local manufacturing engineering group. These changes had to be considered both with and without the other options mentioned above for cycle time reduction.
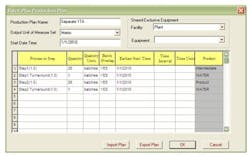
Initially, 96 scenarios with different combinations of options were developed. Their results led to identifying an additional 60 scenarios. All 156 were simulated by setting up a production plan similar to the one depicted in Figure 2. Such an evaluation would have been impractical with the spreadsheet-based analysis on which manufacturing customarily relies.
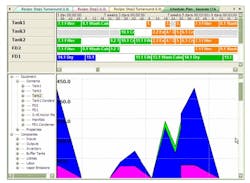
Based on the production plan, the modeling system produces a more detailed schedule (Figure 3). Note the schedule also shows the utilization of Tank 2, the main bottleneck for the cycle time.
Because the model was developed at a very high level, it was easily verified by manually reviewing the recipe and comparing the results with known bottlenecks such as Tank 2. To evaluate purchasing of equipment to address the bottleneck, duplicate units (e.g., a second Tank 2) could easily be added to the equipment pool and the simulations repeated. A single scenario took 15–20 minutes to set up, simulate and capture results. Thus, all 156 scenarios could be simulated, summarized and analyzed in a matter of days.
Verifying that simulations have been set up correctly is straightforward using the model output, for example, by observing the build-up and consumption of intermediate material based on the production plan setup.
IMPRESSIVE RESULTS
The modeling effort produced several combinations of available options that met the campaign time reduction goal. The simulations demonstrated that process changes, without any new capital spending, could reduce cycle times to achieve the goal of 26 weeks per campaign. It also was clear from the results that adding extra tanks alone wouldn’t suffice and wasn’t cost-effective. The chosen scenario involved a combination of several small changes such as increasing batch size by 5%, doing without an extra wash during filtration, and eliminating a purification step.
The simulations produced in the modeling environment allowed the team to evaluate a much wider and more comprehensive set of change combinations than would have been possible using spreadsheet-based tools. In addition, the project was executed much more quickly.
The plant made the changes in late 2010 and has achieved its goal of 26-week campaigns.
Another benefit of the project is that it has spurred the manufacturing team to consider the modeling environment for other purposes. Today, efforts are underway to use it for technology transfer and evaluation of further process improvements.
PRASHANT B. KOKITKAR is a consultant engineer for Eli Lilly and Company, Indianapolis, Ind. JONATHAN KADANE is director of industry marketing for Aspen Technology, Inc., Burlington, Mass. E-mail them at [email protected] and [email protected].


