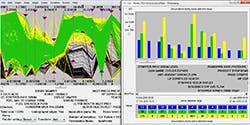
A significantly improved user experience working with large datasets is among important new features introduced with the new version 2.8 of C Visual Explorer (CVE) from Process Plant Computing Limited (PPCL). CVE is a process visualization tool that allows engineers to display hundreds of thousands of measurements across hundreds of variables, allowing them to interrogate historical process and laboratory data. CVE allows users to easily explore operating windows and operating envelopes based on their domain knowledge and without the need for deep understanding of higher mathematics.
Predictive analytics is a time-consuming method that requires a data scientist to interpret the results and provides generalized answers through simplifications that can destroy much of the richness of the data, according to PPCL. By contrast, geometric process control (GPC) – a technology developed at PPCL – reportedly avoids these pitfalls. By providing engineers with graphical tools to work with datasets spanning their entire plant, it allows them to create low-cost predictive models, without equations, to develop new process understanding quickly and easily.
GPC allows engineers to fully explore their data and make discoveries that they can’t now, according to PPCL. It covers the entire process from incoming analysis through processing conditions to final quality variables, KPIs and performance variables.
The basic features of CVE allows faster and easier management of key areas including alarm rationalization, process optimization and plant troubleshooting as well as building and evaluating real-time operating envelope models from C Process Modeller (CPM), PPCL’s online real-time process monitoring and event prediction product. The new features introduced with CVE 2.8 represent advances in three key areas: improved user experience working with large datasets, across the board display improvements and new options for alarm-based variables.


