1660320606252 1005 Fluids Fig 1 Small

Evaluate SMB Chromatography for Your Separation

April 21, 2010
Here's a quick way to determine whether the technique suits your processing needs.

Simulated moving bed (SMB) chromatography is a well-established separation and purification technique useful in commodity and specialty chemical manufacturing. The basic SMB process scheme was patented in 1961 by Broughton and Gerhold at UOP [1].


Over the years, companies have commercialized a number of diverse applications including isolation of p-xylene from mixtures of C8 aromatics, separation of fructose from glucose in the production of high-fructose corn syrup, and purification of various pharmaceuticals such as chiral compounds and biopharmaceuticals [2–6]. A previous article in Chemical Processing, "SMB Chromatography Offers Real Attractions," by Kathleen Mihlbachler and Oliver Dapremont [6], available online at www.ChemicalProcessing.com/articles/2005/538.html, discusses the technology's potential, particularly in the pharmaceutical industry.

In this article, we'll review the basic SMB process scheme with a focus on flow rate requirements, and outline a way to determine whether SMB chromatography makes sense for your application, summarizing methodology we've found useful in our own work [7]. The approach we recommend involves analyzing single column chromatograms or pulse tests. It's an extension of a method introduced by deRosset, Neuzil and Korous in 1976 [8], and enables convenient evaluation of various media properties and operating conditions, such as media type, pore structure, temperature and choice of elution solvent.

As we'll explain, SMB flow rate requirements can be assessed by analysis of elution peaks. For more information about SMB technology in general, see the reviews of process fundamentals by Ruthven and Ching [2], Wankat [3], and Nicoud [4], and discussions of various factors involved in design and scale-up by Pynnonen [5] and Chin and Wang [9]. Although various modifications to the basic SMB processing scheme have been introduced over the years [9], the basic process remains popular.

THE BASICS
The classic SMB chromatography process separates a feed stream containing two or more dissolved solutes into two effluent streams — a stream rich in the relatively slow-eluting solute or solutes (called the extract) and a stream rich in the faster-eluting solutes (the raffinate). An SMB process approaches the efficiency of a true countercurrent solid/liquid process while avoiding problems associated with particle movement. Compared to standard pulse injection (batch) chromatography, SMB operation minimizes product dilution and maximizes productivity of separation media. It can't improve purity or recovery achievable by batch operation but offers much greater operating efficiencies that dramatically reduce capital and operating costs for commercial-scale implementation.
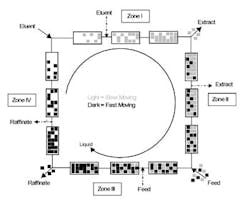
Basic Process Scheme
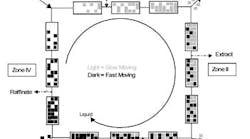
Figure 1. This arrangement typifies four-zone SMB operation. Source: Ref. 7, used with permission from AIChE.A typical process utilizes six to 20 fixed-bed columns or sections of columns. The basic SMB processing scheme involves switching the position of each column through four operating zones (Figure 1). In conventional SMB operation liquid flow rates are steady but in some advanced versions feed and solvent rates change within each cycle. The four SMB zones form an internal loop in which the key slow and fast eluting solutes move in the same direction but at different rates. The inlet and outlet positions for feed, solvent, raffinate and extract move in the same direction through the sequence but at a rate between that of movement of slow and fast solutes. This means that slow and fast solutes move in opposite directions relative to inlet and outlet ports, clockwise or counterclockwise around the loop. Most separation occurs within Zones II and III. Zone I prevents the slow eluter from falling too far back toward Zone IV and into the raffinate outlet. Zone IV stops the fast eluter from going too far forward into Zone I (thus becoming lost in the extract). Elution solvent is added to Zone I to accelerate the slow moving solute to prevent it from falling backward into Zone IV (where it would be lost in the raffinate). For simplicity, Figure 1 shows an equal number of columns allocated to each zone. However, because most of the separation must take place in Zones II and III, these zones generally get more columns, as in a 2-5-4-1 configuration: 2 columns in Zone I; 5 columns in Zone II; 4 columns in Zone III; and 1 column in Zone IV. Figure 2 is a standard SMB plot showing concentrations of bovine serum albumin (BSA) and equine heart myoglobin (EHM) solutes (sampled at a specific time into each step) as a function of column sequence number. This is the position relative to the beginning of Zone I, shown here for a 2-5-4-1 configuration. Brackets with labels indicate where feed and elution solvent are added to the loop and where raffinate and extract are removed. Solute concentrations in the extract and raffinate streams change dramatically over the course of a single step, as illustrated by the bracketed ranges. FLOW RATE REQUIREMENTSFor economical operation, liquid flow rates must be carefully adjusted to obtain desired separation while minimizing solvent consumption. Flow rates are regulated to prevent slow and fast eluting solutes from lapping each other and to generate an internal profile in which, ideally, essentially all of the fast eluter exits in the raffinate and all of the slow eluter exits in the extract. For simplicity, consider a system with only two solutes, a fast eluter A and a slow eluter B. Starting with Zone II, liquid flow rate is chosen so the majority of A moves forward (clockwise) into Zone III but flow rate is limited so the majority of B doesn't enter Zone III. In Zone III, liquid flow rate is selected so B barely moves backward (counterclockwise relative to the inlet and outlet ports) and thus A (being faster) will continue to move forward. Flow rate in Zone III always will exceed that in Zone II because in Zone III flow rate equals the sum of flow rates of Zone II and the entering feed. Zone IV uses the slowest liquid flow rate — chosen to be just slow enough to prevent A from moving from Zone IV into Zone I. It should be no slower than necessary, as this yields a more economical operation because more solvent will be recycled into Zone I, reducing need to add fresh solvent. Zone I uses the highest flow rate, to stop B from falling behind. Flow rate is selected to be just fast enough to force B to move forward. Making this flow too fast requires excess elution solvent. Pulse tests can serve to estimate SMB flow rates. Optimal pulse test uses a single column of the same length and filled with the same media as envisioned for the commercial scale. For economical commercial-scale operation, particle diameters typically are on the order of 200 to 350 microns to avoid excessive pressure drop [5,7]. A column of 0.5-in. (1.3-cm.) diameter or larger is needed to avoid significant wall effects. To provide adequate separation performance with the larger particle diameters, column length usually is at least 3 ft. (approximately 1 m).
Concentration Profile
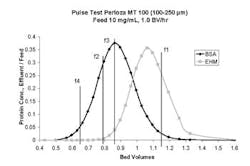
Figure 2. Typical profile for a 2-5-4-1 configuration also indicates where streams enter and leave. Source: Ref. 7, used with permission from AIChE.Figure 3 presents pulse test data generated in a study of protein separations. The fast eluting solute is BSA, the slow eluting solute is EHM and the eluent is a dilute buffered solution of NaCl in water. The graph shows solute concentration in the effluent [relative to that in the feed] versus the number of empty bed volumes (BV) of feed liquid that have passed through the column. The peaks in Figure 3 don't show baseline resolution, which is unneeded and, in fact, undesirable. Instead, the goal is to separate the leading edge of the first peak from the trailing edge of the second. Unlike analytical chromatography, peaks should overlap significantly while maintaining good purities within the leading-edge and trailing-edge regions. This facilitates a good binary separation at maximum productivity potential. If overlap is small, increase the concentration of solute in the feed pulse and repeat the test. Ideally, for most economical SMB operation, all peaks should elute within about 1 to 3 BV, as too much retention by the media is undesirable. Some applications require up to 7 or 8 BV for everything to elute; this may be acceptable — but only if the product is particularly valuable. Once a satisfactory separation has been achieved, pulse test data can be interpreted to determine profile advancement factors. We define the profile advancement factor as normalized liquid flow within each zone: fk = Qk tstep /Vcolumn(1) where fk is the profile advancement factor for Zone k, Qk is the liquid flow rate within Zone k, tstepis the step time for the process and Vcolumn is the total empty volume of a column or column section. The basic procedure involves the following steps [7]: 1. Start with Zone III. From the pulse test chromatogram, choose a BV value that includes a large fraction of fast eluter but only a small fraction of slow eluter (at the leading edge of the second peak). The goal is to select a value that achieves high recovery of fast eluter in the raffinate while minimizing contamination by the slow eluter. Set f3, the profile advancement factor in Zone III, equal to this BV value. 2. Go to Zone IV. Choose a BV value that includes some of the fast eluter but only a small fraction of this component (at the leading edge of the first peak). The goal is to select a value that prevents fast eluter from moving forward into Zone I but is as large as possible to minimize the required amount of fresh elution solvent that needs to be added to Zone I. Set f4 equal to this value.

Pulse Test Results
Figure 3. Data for protein separation show suitable overlap between peaks. Source: Ref. 7, used with permission from AIChE. 3. Then address Zone I. Choose a BV value that includes a majority of the slow eluter and almost all of the fast eluter (at the trailing edge of the first peak). The goal is to choose a value that prevents slow eluter from falling back into Zone IV but is as small as possible to minimize the required amount of elution solvent. Set f1 equal to this value. This procedure can be visualized as the mirror image of the procedure used to select f3, by interpreting the chromatogram from right to left instead of left to right. 4. Choose a maximum face velocity, the maximum velocity of total liquid flow at the entrance to a column. Normally this doesn't exceed about 10 cm/min (about 3 gal/min per ft2 of cross-sectional area). A study of face velocity effects may be conducted in the course of running pulse tests. Maximum velocity will determine the step time. 5. Now turn to Zone II. Determine a value for f2 by the process material balance. The value should fall between those of f4 and f3 such that f4 < f2 < f3 < f1. 6. Find corresponding flow rates for each zone from Eq. 1 and the process material balance. PROCESS ECONOMICSIf pulse test results indicate a proposed separation is technically feasible, the next step is to evaluate process economics. In large-scale commodity separations the major cost comes from the need to isolate the product from one of the effluent streams and recover and recycle the elution solvent [5]. A typical process dilutes the solute by a factor of two or more. The magnitude of this dilution effect will decrease as the difference between the profile advancement factors f1 and f4 is reduced; flow rate values obtained from a pulse test may be used to estimate the amount of dilution. If this analysis suggests the process is economically attractive, then we recommend performing a mini-plant study. Use the flow rates estimated from the pulse test analysis for the startup flow rates and step time. A mini-plant study helps to demonstrate the required separation, to develop an accurate process simulation and to further refine and optimize the operation to maximize productivity (the mass of desired product attained per unit volume of separation media) and minimize solvent consumption (mass or volume of solvent consumed per unit mass of product) [7]. We've successfully used this strategy to evaluate and optimize the protein separation cited earlier and to evaluate a number of proprietary applications. Initial feasibility often can be assessed in a week or two of pulse test work; subsequent mini-plant work can be completed in one or two months, providing sufficient information to develop budgetary estimates of capital and operating costs for a large-scale installation. BRUCE PYNNONEN is a senior applications specialist and SHAWN FEIST is a lead engineer with Dow Water and Process Solutions, Midland, Mich. YOGESH HASABNIS is a senior engineer in the Engineering & Process Sciences Laboratory at Dow's Research Center in Pune, India. DAVE ALBERS is a research scientist in Dow's Analytical Sciences Laboratory in Midland. TIMOTHY FRANK is a fellow and senior technical manager at Dow's Engineering Sciences Laboratory in Midland. Contact them via[email protected].REFERENCES1. Broughton, D.B. and C.G. Gerhold, "Continuous Sorption Process Employing Fixed Beds of Sorbent and Moving Inlets and Outlets," U.S. Patent 2,985,589 (1961).2. Ruthven, D.M. and C.B. Ching, "Counter-current and Simulated Counter-current Adsorption Separation Processes" Chem. Eng. Sci., 44, pp. 1,011–1,038 (1989).3. Wankat, P.C., "Separation Process Engineering," 2nd ed., pp. 649–654, Prentice Hall, Upper Saddle River, N.J. (2007).4. Nicoud, R.M., "Simulated Moving-Bed Chromatography for Biomolecules," pp. 475–509, Chapter 13 in "Handbook of Bioseparations," S. Ahuja, ed., Academic Press, San Diego, Calif. (2000).5. Pynnonen, B.W., "Simulated Moving Bed Processing: Escape from the High-Cost Box," J. Chromatogr. A, 827, pp. 143–160 (1998).6. Mihlbachler, K. and O. Dapremont, "SMB Chromatography Offers Real Attractions," Chemical Processing, 68, No. 9, pp. 38–41 (Sept. 2005).7. Feist, S.D., Hasabnis, Y., Pynnonen, B.W. and T.C. Frank, "SMB Chromatography Design Using Profile Advancement Factors, Miniplant Data, and Rate-Based Process Simulation," AIChE J., 55, No. 11, pp. 2,848–2,860 (Nov. 2009).8. deRosset, A.J., Neuzil, R.W. and D. J. Korous, "Liquid Column Chromatography as a Predictive Tool for Continuous Countercurrent Adsorptive Separations," Ind. Eng. Chem. Proc. Des. Dev., 15, pp. 261–266 (1976).9. Chin, C.Y. and N.-H.L. Wang, "Simulated Moving Bed Equipment Designs," Separation and Purification Rev., 33, No. 2, pp. 77–155 (2004).

Sponsored Recommendations

Keys to Improving Safety in Chemical Processes (PDF)

Many facilities handle dangerous processes and products on a daily basis. Keeping everything under control demands well-trained people working with the best equipment.

Get Hands-On Training in Emerson's Interactive Plant Environment

Enhance the training experience and increase retention by training hands-on in Emerson's Interactive Plant Environment. Build skills here so you have them where and when it matters...

Rosemount™ 625IR Fixed Gas Detector (Video)

See how Rosemount™ 625IR Fixed Gas Detector helps keep workers safe with ultra-fast response times to detect hydrocarbon gases before they can create dangerous situations.

Micro Motion 4700 Coriolis Configurable Inputs and Outputs Transmitter

The Micro Motion 4700 Coriolis Transmitter offers a compact C1D1 (Zone 1) housing. Bluetooth and Smart Meter Verification are available.