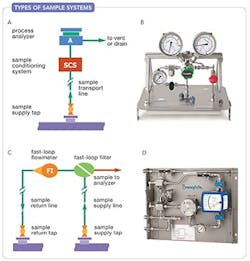
Figure 1. Single-line system (a, b) disposes of sample while fast-loop system (c, d) returns sample to process. Source: “Industrial Sampling Systems.”
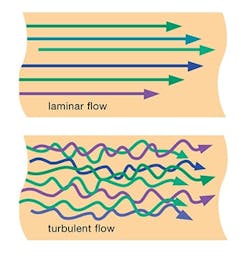
The final step in designing sample lines for your analytical sampling system is to assess whether enough pressure differential exists between the process tap and the return point to drive the flow you want through the lines. If the differential isn’t sufficient, you may have to apply a different design strategy.At this stage of the design process, you already will have made numerous decisions related to your system layout and performance. You’ve decided on whether to use a single-line system (Figures 1a and 1b) that disposes of samples via a vent or drain, or a fast-loop system (Figures 1c and 1d) in which the sample returns to process (“Choose the Right Sampling System Transport Line”). You’ve estimated your time delay and made adjustments to meet your acceptable target. You’ve made design decisions related to fluid velocity and flow, and found whether laminar or turbulent flow (Figure 2) occurs in your sample lines (“Consider Flow Regime’s Impact on Sample Analysis”).
Now, you’re ready to determine the pressure loss in your sample lines. Multiple factors, including line length and diameter, the number of bends in a system, elevation changes, friction, sample fluid density, flow velocity, and other factors, cause pressure drop. If your sample lines require more differential pressure than currently available, you won’t achieve the desired sample velocity. You may need to install a sample pump or move the process tap to a higher-pressure line.
To compute the pressure loss in your sample lines, you must use the Darcy equation. We’ll review this equation and provide some guidelines for maintaining a suitable pressure differential in your system.
Finding Pressure Loss
The Darcy equation allows you to determine if enough pressure difference exists between the sample tap and return point to achieve the desired response time for your sampling system. If not, you’ll have to modify the design, perhaps by using a larger return line. If excess pressure is available, you might choose to use smaller sample line sizes or to absorb the excess pressure across a needle valve.
If you design your sample lines to absorb all the available pressure, you can save the cost of a flowmeter and needle valve. However, you won’t be able to check the performance after installation, except by recalculating the flow rate and time delay based on the actual pressures observed during startup.
Either way, you must calculate the required differential pressure using the Darcy equation:
ΔP = (f L ρ u2)/2D (1)
where ΔP is change in pressure (Pa), f is friction factor (dimensionless), L is line length (m), ρ is fluid density (kg/m3), u is flow velocity (m/s) and D is line diameter (m).
Entering all values in coherent SI units yields a ΔP value in pascals (Pa). A shortcut version of the equation accepts the line diameter (D′) in millimeters and returns the pressure drop (ΔP′) in kilopascals (kPa):
ΔP′ = (f L ρ u2)/2D′ (2)
When making any adjustments to your system, your design work will focus on the flow velocity (u) and the line diameter (D) because application conditions fix the other variables. Keep in mind that the friction factor (f) isn’t a constant. It varies with operating conditions; you must account for any condition changes that may alter the friction factor and how it’s calculated.
Figure 2. Turbulent flow encourages good sample mixing. Source: “Industrial Sampling Systems.”
Application To Gas Samples
Strictly speaking, the Darcy equation doesn’t directly apply to gas samples because their density and velocity both change as the pressure drops along the line. However, in typical sampling lines, gas samples have very little pressure drop, so the accuracy of the calculation usually isn’t an issue. If your initial calculation yields a significant line pressure drop, you can improve accuracy by averaging the inlet and outlet pressures and repeating the calculation.
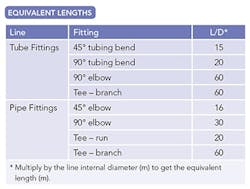
Allowing for bends. Each sharp bend in a line will incur some additional pressure loss that you must account for in your calculations. When possible, install lines with gradual bends because they barely will affect the pressure drop. If this is impractical and you must use pipe or tube fittings, or bends formed with tube benders, it’s convenient to assign an equivalent length to each bend to represent the pressure drop it causes.
Table 1 lists some typical equivalent lengths expressed as multiples of the internal diameter. Multiply the appropriate length-to-diameter ratio (L/D) by your line bore to get the equivalent length of each tube bend or fitting.
For example, ½-in. tube has a bore of about 10 mm and a 90° tubing elbow has an L/D ratio of 60. Therefore, each elbow tube fitting adds an extra 0.6 m to the effective length of the line:
0.01 m × 60 = 0.6 m
You also must account for various pipe fittings and valves in the system. You can obtain equivalent lengths for these components from available resources, such as the International Electrotechnical Commission standard IEC/TR 61831 for pipe fittings and valves, as well as manufacturers’ Cv values for valves and other flow components.
Table 1. Add the equivalent length of all fittings to actual line length for a value to use in the Darcy equation. Source: “Industrial Sampling Systems.”
Total the equivalent lengths of all the bends, fittings and components in your lines. Then, add this sum to the actual line length, and use this value for L in the Darcy equation to calculate the pressure drop. If you don’t have enough ΔP, you may need to reduce the number of bends.
Allowing for elevation change. Liquid samples lose pressure when raised to a higher elevation and gain pressure when coming down. Often, the pressure lost going up equals the head gained when returning to grade. The net result is a wash. Even so, always check that enough source pressure exists to reach the higher elevation.
To calculate the static head gained or lost from an elevation change (h), use the following equation:
ΔP = h ρ g (3)
where ρ is the liquid mass density (kg/m3) and g is the acceleration due to gravity (9.81 m/s2).
As a memory aid, note that water at 4°C has a mass density of 1,000 kg/m3. When a cold water line rises 10 m to an overhead pipe rack, its pressure drops by 98 kPa (about 1 bar):
ΔP = 10 m × 1,000 kg/m3 × 9.81 m/s2 = 98,000 Pa
Elevation usually doesn’t affect gas samples to any significant degree because it takes about 100 km of elevation to create an ambient air pressure of 1 bara.
Using a larger return line. Most fast loops have supply and return lines about equal in size and length (Figure 1d), making the pressure drop the same in each. This arrangement produces a convenient and simple design when enough pressure is available to drive both lines. However, when you must contend with limited available pressure differential, you can’t afford to waste half of it on the return.
A useful strategy to minimize the pressure absorbed in the return line is to increase its diameter because the velocity of a fluid drops when it enters a wider line. For example, going from a supply line with 10.2-mm internal diameter (½-in. tube) to an equal-length return line with 15.8-mm internal diameter (¾-in. tube) will split the pressure drop such that only about 10% occurs in the return line. The other 90% of ΔP goes to moving the sample to the analyzer. The friction factor of your system may alter this effect slightly. However, in general, when the return line is one line size larger than the supply line and is about equal in length, it’s safe to assume that approximately 85% of ΔP is available to drive the sample to the analyzer.
When dealing with marginal available ΔP, fast loops using larger return lines often are less expensive to install than same-size designs and consume far less flow. For example, you can match the response time of a fast loop with low differential pressure that uses 1-in. tubing by opting instead for ½-in. supply tubing and ¾-in. return tubing. The alternative system would run at only 25% of the original flow rate, making it a better design choice because it’s cheaper to install, uses less sample material and is less likely to interfere with process operations.
When using a fast loop, ensure enough flow exists to drive your fast-loop filter; manufacturers specify a minimum flow rate for self-cleaning filters.
Using a larger return line also makes sense when a common return line serves multiple fast loops. In this case, choose a line size that can handle the total flow with a pressure drop that’s acceptable for each of the fast-loop supply lines. To calculate the pressure drop, estimate the density and viscosity of the mixed return fluid. Keep the pressure drop in the return line as low as possible so the return pressure doesn’t vary with the number of fast loops running — otherwise you may affect the performance of the analyzers.
Using a smaller return line. When you have ample pressure differential, it’s possible to install a smaller return line to maximize sample pressure to the analyzer. This rarely is done, though. Instead, most designers opt for a needle valve to allow flow and pressure adjustments, and minimize their design risk.
Watch The Bubble Point
When transporting a volatile liquid, you must ensure high enough pressure at every point in the line to suppress bubble formation. When a liquid flows through horizontal lines or gains elevation, its pressure drops, thus reducing its bubble point temperature. If the pressure falls enough, the liquid will start to bubble or boil and may begin to foam. In an elevated line, vapor lock might occur and prevent further liquid flow.
Check for the lowest pressure in the transport line system, not forgetting its highest elevation. If the pressure dips too low, you must modify the design to cool the liquid or increase its source pressure at the sample tap before the pressure drop occurs.
To cool the sample flow, use a heat exchanger. Don’t assume the liquid will cool sufficiently as it travels down a bare line.
If you opt for a pump to increase pressure, install it at grade close to and below the process nozzle, and put a larger line on its suction side. Never mount a pump at a higher elevation than the sample tap. Also, keep in mind that the gear pumps typically used for sample lines are positive displacement devices that create a constant flow. Because the pump controls the flow, you can’t install a needle valve in the fast loop to do the same thing.
Final Thoughts
To ensure your analytical sampling system delivers adequate flow to meet your desired response time, you must have a sufficient pressure differential between the supply tap and return point. Too little pressure differential will delay your analysis and potentially create issues like bubbling of a liquid sample. Use the Darcy equation to calculate the pressure differential your system design needs and then determine if you must adjust any variables to achieve your desired target. Don’t be surprised if you must make changes. The design process is iterative. Therefore, it’s useful to enter your system data and the equations into a spreadsheet so you can review a variety of options before arriving at an optimal system for your application.
Managing Sample System Flow
This article is the third in a three-part series on the topic. It was adapted from “Industrial Sampling Systems: Reliable Design and Maintenance for Process Analyzers” (2013), a process sampling textbook authored by Tony Waters and published by Swagelok Company. For more information, visit www.industrial-sampling-systems.com.
RANDY RIEKEN is market manager for chemical and refining for Swagelok Company, Solon, Ohio. Email him at [email protected].
